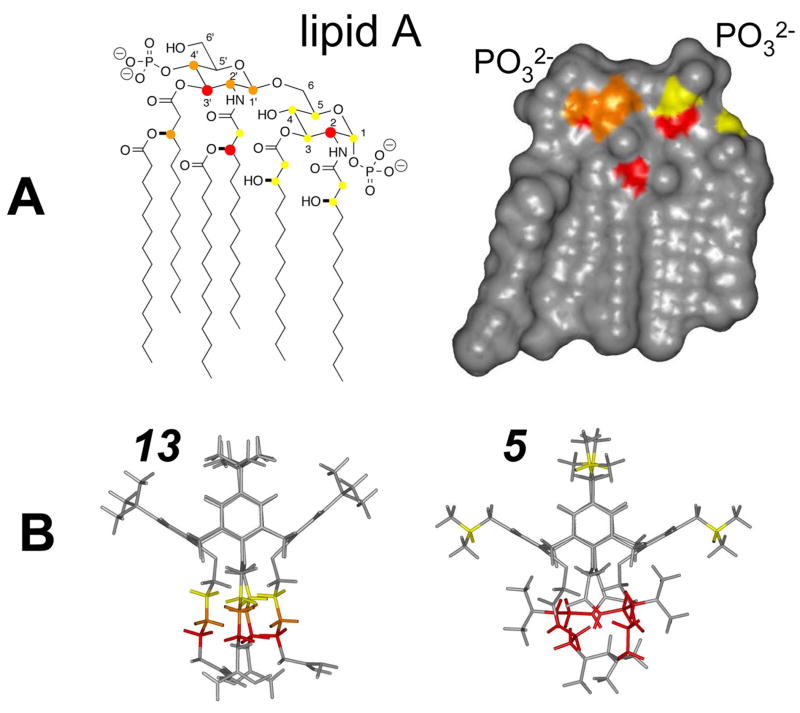
Figure 6.
Structures of lipid A and compounds 5 and 13 highlighting probable binding sites. The chemical structure (A left) and calculated Connoly surface (A right) of hexaacyl lipid A from E. coli are shown. In panel A left, proton resonances affected by the binding of compounds 5 and 13 are labeled using solid circles. Large red circles correspond to the largest chemical shift changes (>0.03 ppm), whereas orange and yellow circles indicate intermediate (0.02–0.03 ppm) and small (<0.02 ppm) chemical shift changes. The same color codes are used in A right to indicate the probably site of interaction with 5 and 13. (B) Energy minimized structures of compounds 5 and 13 are displayed. Chemical groups whose resonances are most affected by interaction with lipid A are color coded as described above.

