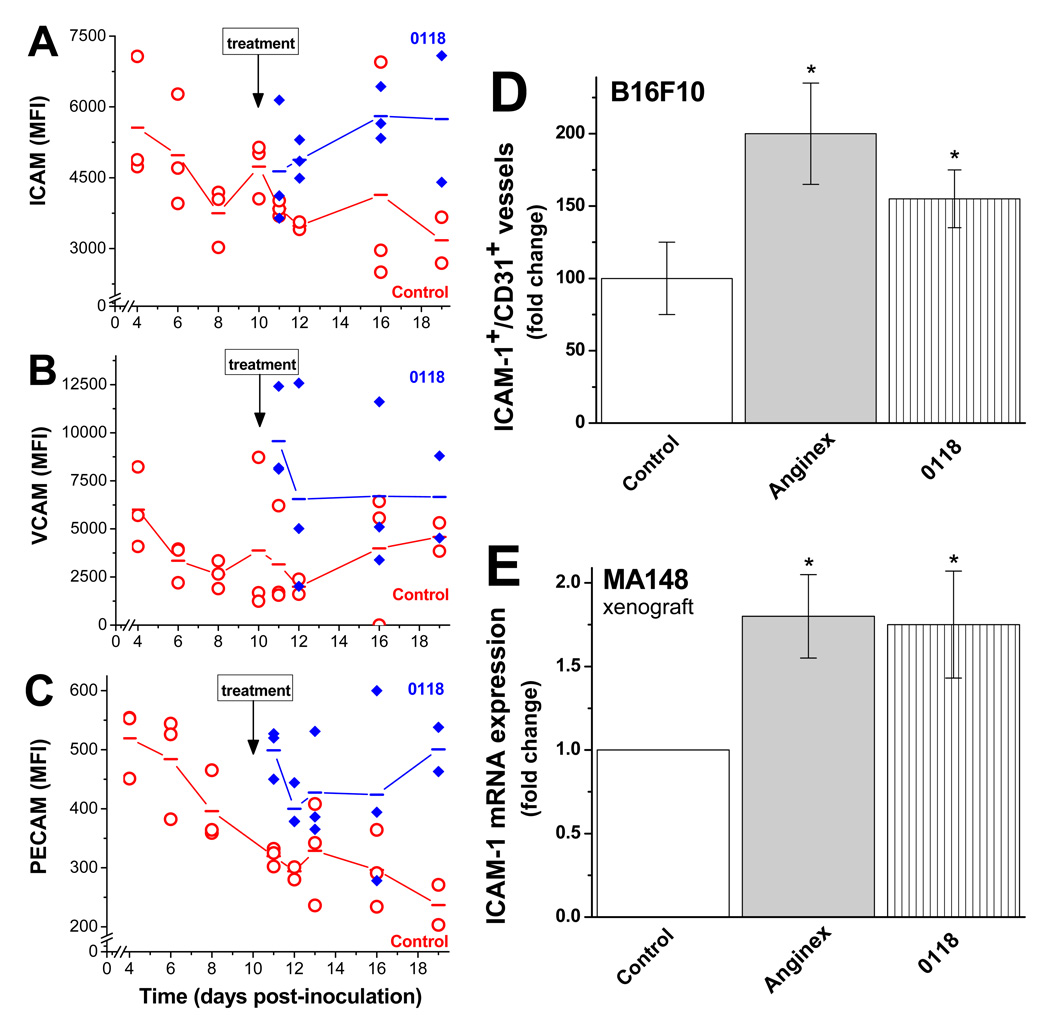
Figure 2. Time course of tumor EAM and angiostatic inhibitor intervention.
Multi-color FACS analysis was used to simultaneously measure the amount of ICAM-1 (A), VCAM (B), and PECAM (C) on tumor endothelial cells during B16F10 tumor growth, as well as the effect from treatment with 0118. Treatment with 0118 (10 mg/kg IP BID) was initiated on day 10 post inoculation with cultured tumor cells. Mean fluorescence intensities (MFI) are shown for tumor-derived single cell suspensions from individual mice, and lines connect the mean values determined on each day examined. (D) Immunohistochemistry was used to quantify ICAM-1 positive vessels in B16F10 tumors of mice with or without anginex or 0118 treatment (n=6), shown as the relative mean number of ICAM-1 positive vessels per CD31 positive vessels, as fold changes compared to untreated mice (± SEM; *p<0.05). (E) Quantitative real-time RT-PCR analysis of the effect of angiostatic treatment on expression of murine ICAM-1 expression, using mouse specific primers, in the stroma of human MA148 tumors in mice. Data are presented as the relative mean expression as fold changes compared to untreated mice (± SEM; *p<0.05).

