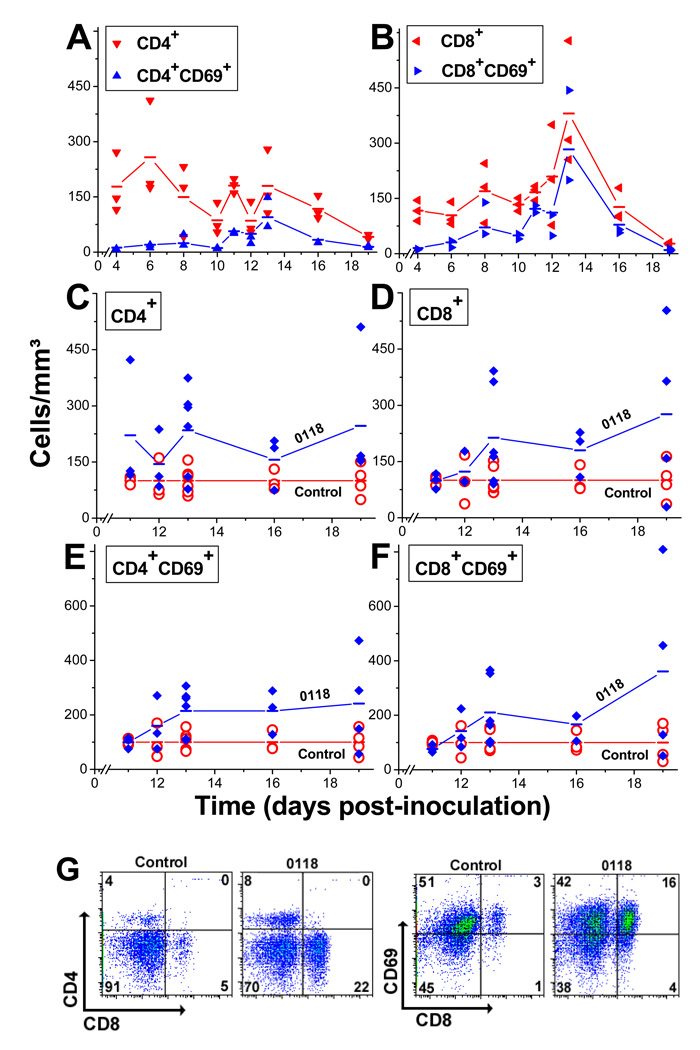
Figure 3. Changes in T cell populations during tumor growth.
Multi-color FACS analysis was used to simultaneously measure changes in T cell populations in B16F10 tumors during growth. Data is shown as points for individual mice, and lines connect the mean values for CD4+ and CD4+CD69+ cells (A), and CD8+ and CD8+CD69+ cells (B). Relative enhancement in the number of CD4+ (C), CD8+ (D), CD4+CD69+ (E), and CD8+CD69+ (F) cells in tumors treated with 0118. In order to correctly compare different size tumors throughout the course of the experiment, results are depicted as cells/mm3. (G) Exemplary FACS analysis dot plots for control and 0118-treated B16F10 tumor-derived cell suspensions on day 13, stained for CD4, CD8, and CD69.

