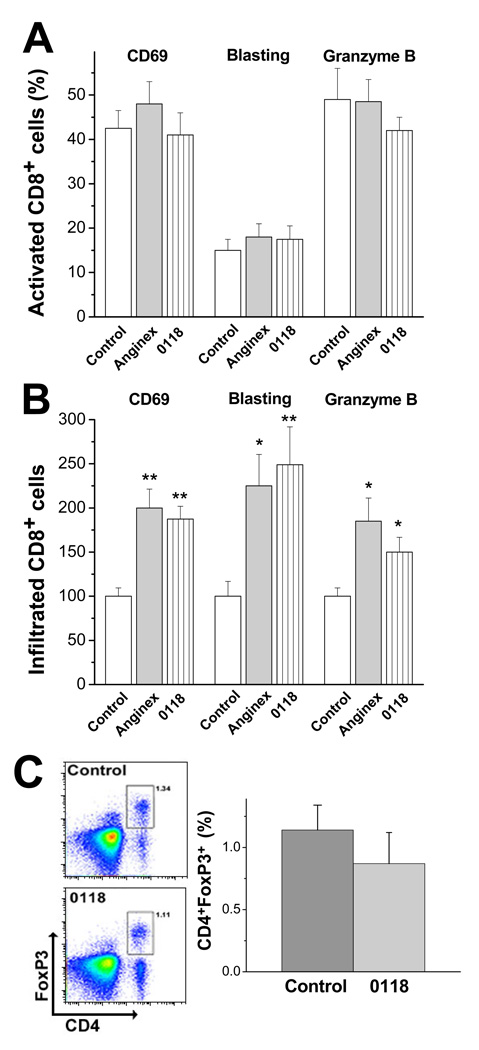
Figure 4. Infiltration of tumor-specific cytotoxic T lymphocytes.
(A) Percentage of activated CD8 cells within the CD8 population (as indicated by CD69, blasting and granzyme B analysis) in untreated and treated tumors (n= 9 each). (B) Amount of activated CD8+ cells in tumors treated with anginex or 0118 normalized to the control (n=9 each). Results are presented as relative mean values of 2 independent experiments (± SEM; *p<0.05, **p<0.005). (C) Exemplary flow cytometric analysis of B16F10 tumors for Tregs (CD4+Foxp3+) in untreated and 0118 treated wild type mice (left panel). Quantification of the amount of Tregs in 0118 treated and untreated tumors (right panel; means ± SEM; n=3 each group)).

