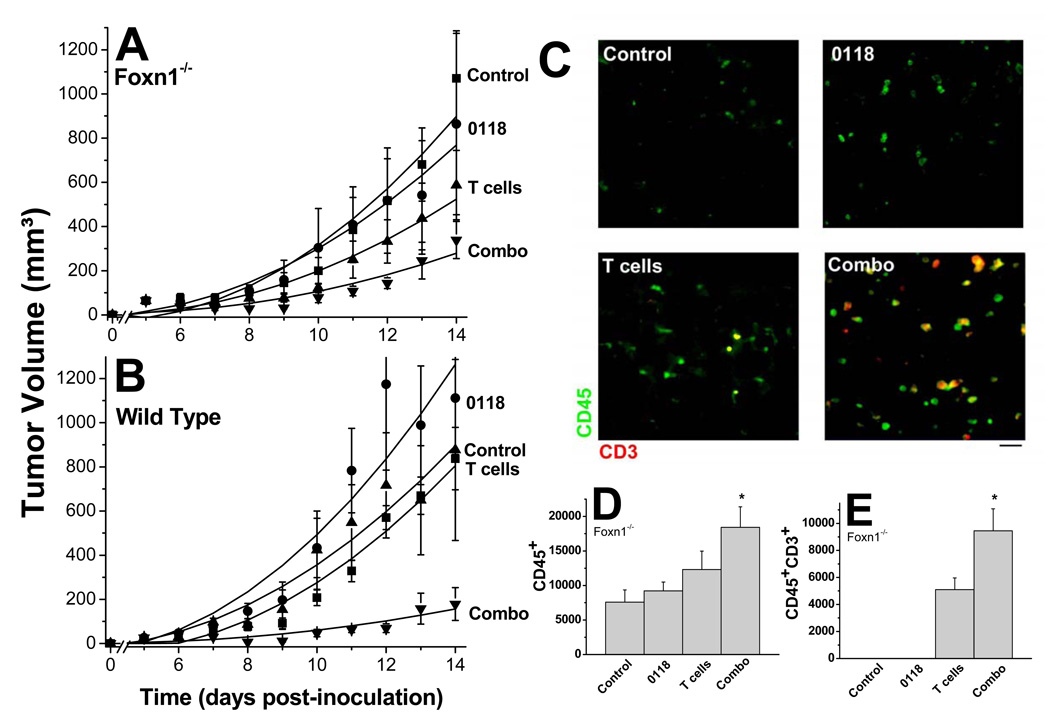
Figure 6. Adoptive T cell immunotherapy in mice.
B16F10 tumor growth was monitored in T cell deficient Foxn1−/− (A) and wild type (B) mice treated with 0118 (10 mg/kg IP BID, days 5 and 6), transferred with T cells (2 × 10⁷ IP, day 7), or a combination, compared to untreated control mice (n=6–16 for each group). Unlike the studies shown in Figure 6, angiostatic treatment was administered for only 2 days, for reasons discussed in the text. Data are shown as mean (± SEM) interval with polynomial trendline curve fitting (C) Exemplary immunofluorescence stainings of B16F10 tumor tissue are shown for leukocytes (CD45; green) and T cells (CD3; red) for control, 0118, T cell transferred, or combination-treated Foxn-1−/− mice. Quantification (mean ± SEM; *p< 0.01)) of CD45+ cells (D) and CD45+CD3+ cells (E) in B16F10 tumors, untreated or treated with 0118, T cells, or the combination.

