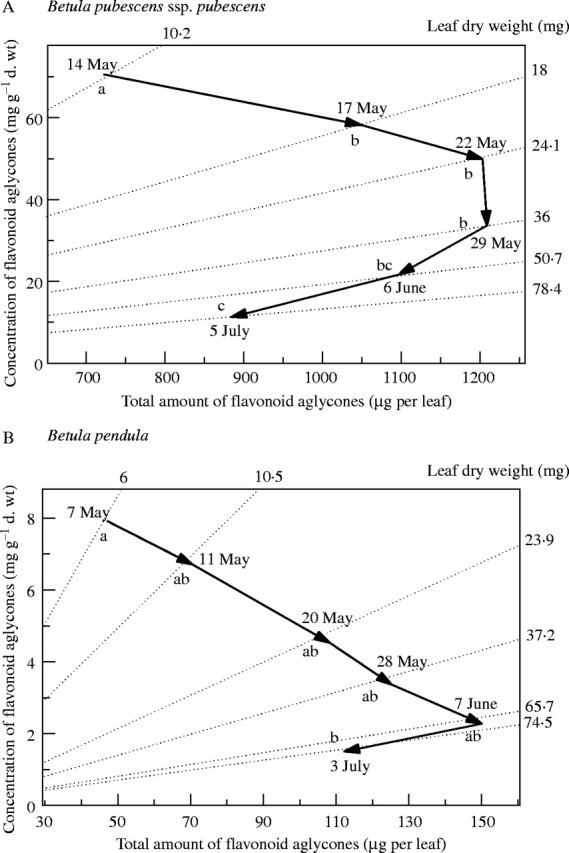
Fig. 6.

Changes in total concentrations and total amount of surface flavonoids and in leaf dry weight during leaf development in B. pubescens ssp. pubescens (A) and B. pendula (B). Dates correspond to stages 1–6 of leaf development (see Materials and methods). For each sampling date, mean concentration of flavonoid aglycones is plotted against corresponding total amount per leaf. Diagonal lines indicate mean leaf dry weight at each sampling date. Direction of vector from earlier sampling date to later one indicates changes in concentrations and total amounts of flavonoids between the two dates. For example, vertical shifts indicate that there are no changes in the total amount of flavonoids per leaf and changes in concentrations are caused by changes in leaf biomass. On the other hand, a horizontal shift to the right indicates that the rate of flavonoid synthesis is matched by changes in leaf biomass so that no changes in concentrations occur. Different letters indicate significant difference among stages of leaf development for total amount of flavonoid aglycones at P < 0·05.
