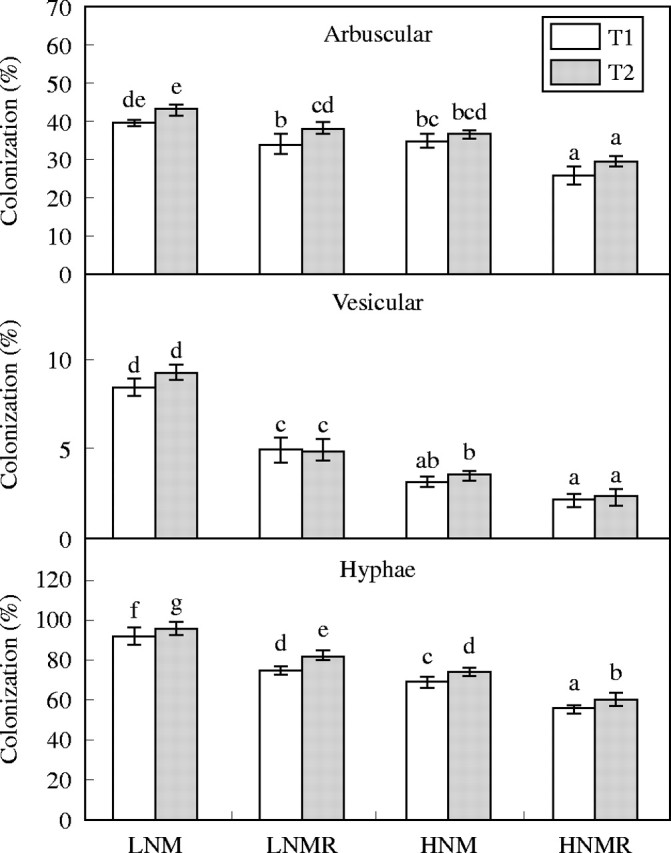
Fig. 1.

Percentage of arbuscular (AC%), vesicular (VC%) and hyphae colonization (HC%) in response to Rhizobium inoculation, low nitrogen (LN = 10 ppm) and high nitrogen (HN = 250 ppm N) supply at two harvests (T1 and T2). Vertical bars represent s.e. (n = 4) of the means. Different letters indicate significant differences assessed by the Tukey HSD test (P < 0·05) after performing three-way ANOVA with residual estimation.
