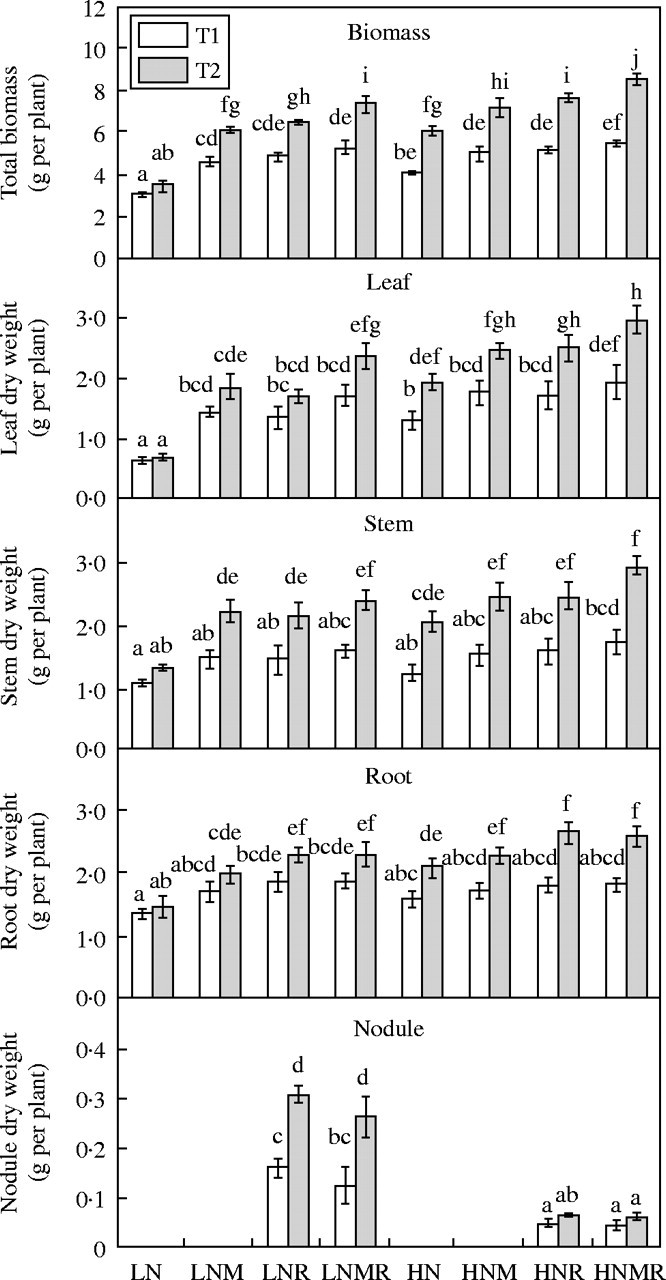
Fig. 2.

Leaf, stem, root, nodule dry weight production and total biomass as influenced by nitrogen supply (LN and HN) and microbial symbiotic association (N, NM, NR and NMR) at two harvests (T1 and T2). Vertical bars represent s.e. (n = 4) of the means. Different letters indicate significant differences assessed by Tukey HSD test (P < 0·05) after performing three-way ANOVA with residual estimation.
