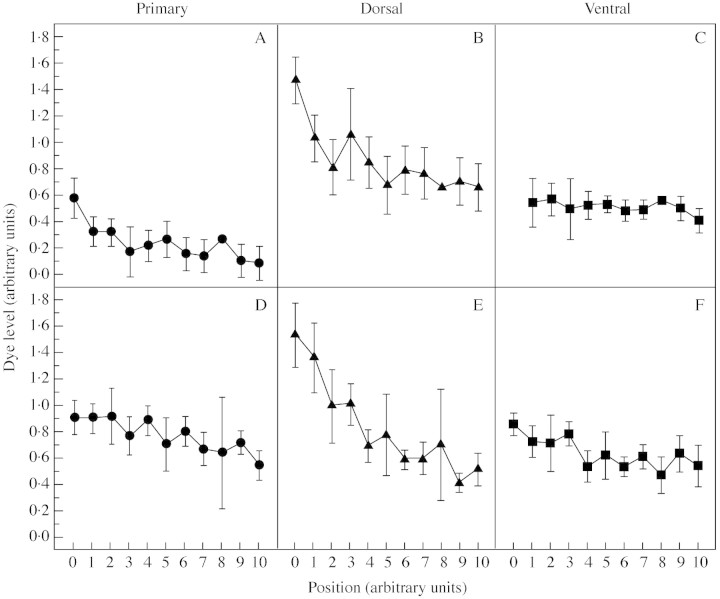
Fig. 4. Longitudinal changes in the functionality of xylem in (A–C) ‘Braeburn’ and (D–F) ‘Granny Smith’, assessed at 160 and 163 DAFB, respectively. Each point represents the means dye level for the primary, dorsal and ventral vascular bundles falling within the same fractional distance between ‘0’ (near the stalk end) and ‘10’ (near the calyx end) of the fruit. Vertical bars represent s.e.

An official website of the United States government
Here's how you know
Official websites use .gov
A
.gov website belongs to an official
government organization in the United States.
Secure .gov websites use HTTPS
A lock (
) or https:// means you've safely
connected to the .gov website. Share sensitive
information only on official, secure websites.
