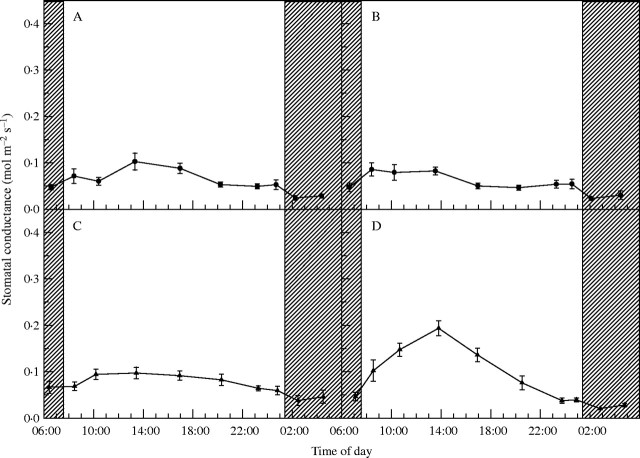
Fig. 2.
Stomatal conductance of lettuce leaves grown under (A) red and blue LEDs (RB), (B) red and blue LEDs with green fluorescent lamps (RGB), (C) green fluorescent lamps (GF) and (D) cool white fluorescent lamps (CWF) during an 18-h photoperiod. Sequential measurements were taken 23 d after planting. Data represent means ± s.e. of 12 measurements. Within the photoperiod, darkness is indicated by cross-hatching.

