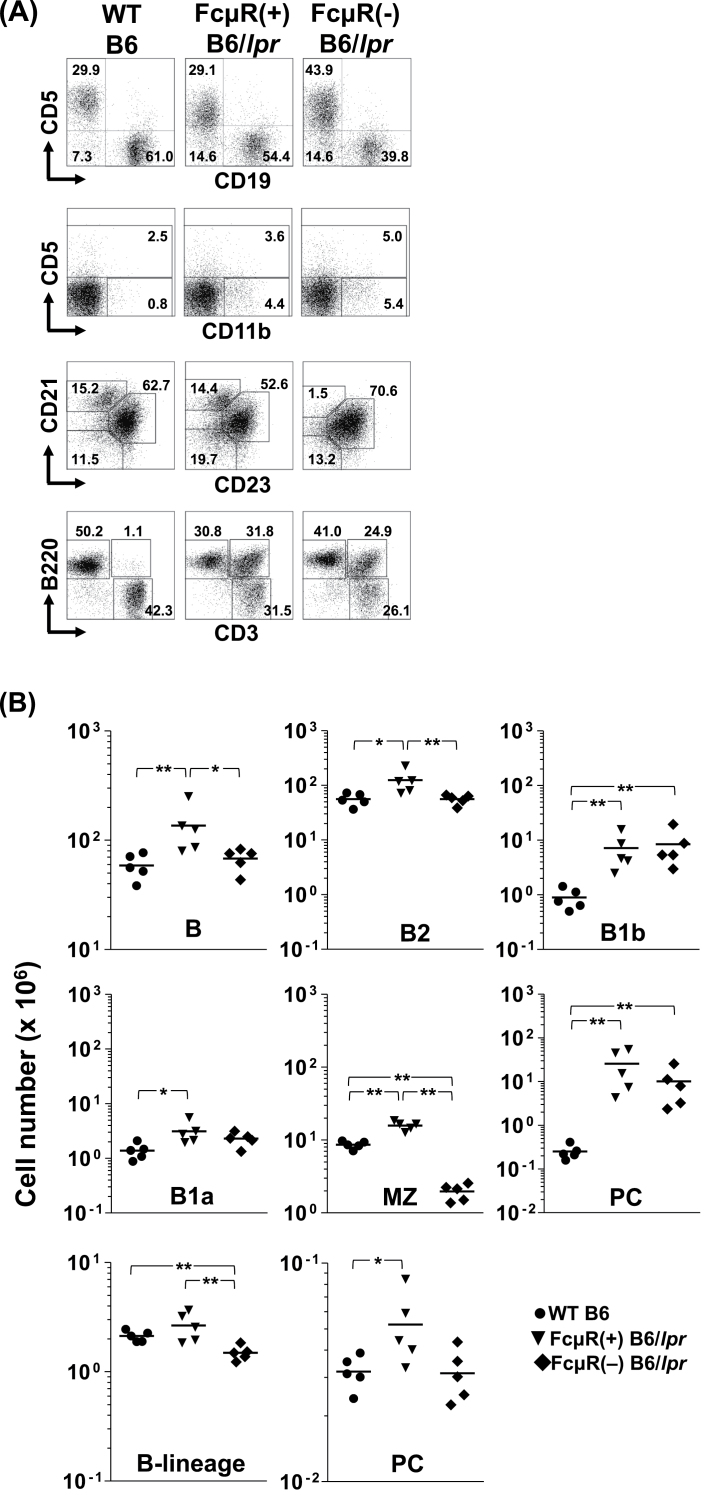
Fig. 3.
Immunofluorescent assessment of cellular compartments in Fcmr −/− and control B6/lpr mice. (A) Representative immunofluorescence profiles. Splenocytes (top three rows) and LN cells (bottom row) isolated from WT B6 (left column), FcμR(+) B6/lpr (middle column) and FcμR(−) B6/lpr (right column) female mice at 20 weeks of age were first incubated with FcγR-blocking reagents and then with fluorochrome-labeled mAbs specific for the indicated surface markers. Stained cells with the light scatter characteristics of lymphocytes/macrophages were analyzed using an Accuri C6 flow cytometer. In the second and third rows, the CD19+ B cells were gated and examined for their expression of the indicated surface markers. Numbers indicate percentages of cells. Note (i) a sizable population of CD11b+/CD5− B cells, (ii) marked expansion of CD3+/B220+ atypical T cells in both FcμR(+) and FcμR(−) B6/lpr mice and (iii) a clear reduction of CD21+/CD23− MZ B cells in FcμR(−) B6/lpr mice. (B) Total cell numbers in each population in spleen (top two rows) and BM (bottom row) from WT B6 (closed circles), FcμR(+) B6/lpr (closed inverted triangles) and FcμR(−) B6/lpr (closed diamonds) mice (five in each group). Each symbol represents data from an individual mouse. The horizontal bar indicates the arithmetic mean. *P < 0.05 and **P < 0.01, respectively. Note (i) normal levels of splenic B and B2 cells and marked reduction of MZ B cells in FcμR(−) B6/lpr mice, (ii) comparable levels of B1b and B1a cells as well as plasma cells in both FcμR(+) and FcμR(−) B6/lpr mice and (iii) significant reduction of BM mature B cells and normal levels of BM plasma cells in FcμR(−) B6/lpr mice.

