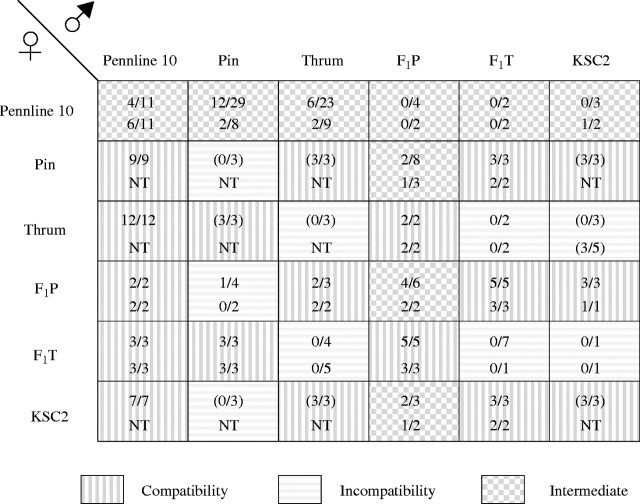
Fig. 2.
Pollen tube growth in each cross combination. Data are presented as number of styles with pollen tubes reaching the ovule/number of pistils pollinated. Upper values are findings at 6 h after pollination, and lower values are those at 24 h after pollination. Values in parentheses are from Matsui et al. (2003b). NT, not tested.

