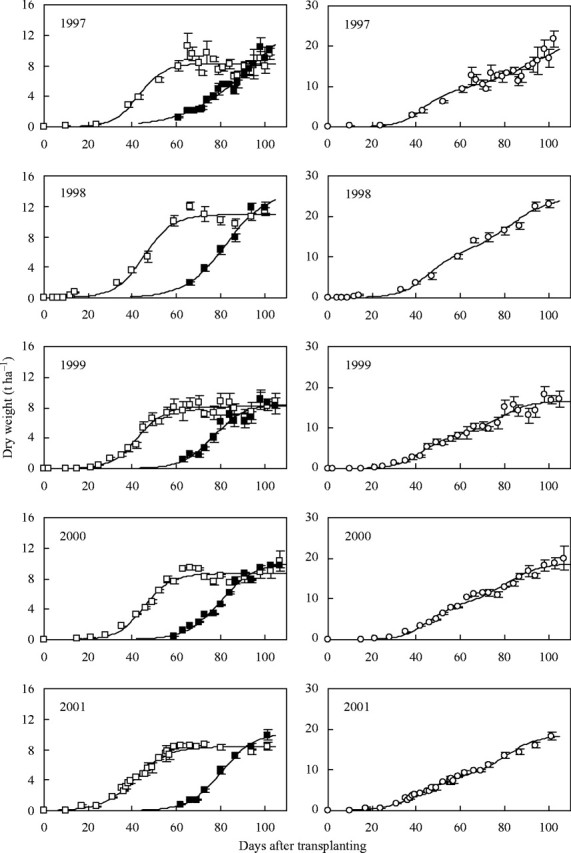
Fig. 2.

Above-ground biomass (open circles), and its components [vegetative parts (open squares) and panicle (solid squares)] for crops of IR72 grown in the dry season at IRRI between 1997 and 2001. The error bars are standard errors based on six replicates. Separate logistic curves fitted to the vegetative parts and to the panicles are shown in the graphs on the left. On the right, the line is the sum of the two logistic curves, shown with above-ground biomass; note that this line is not fitted to the data points shown.
