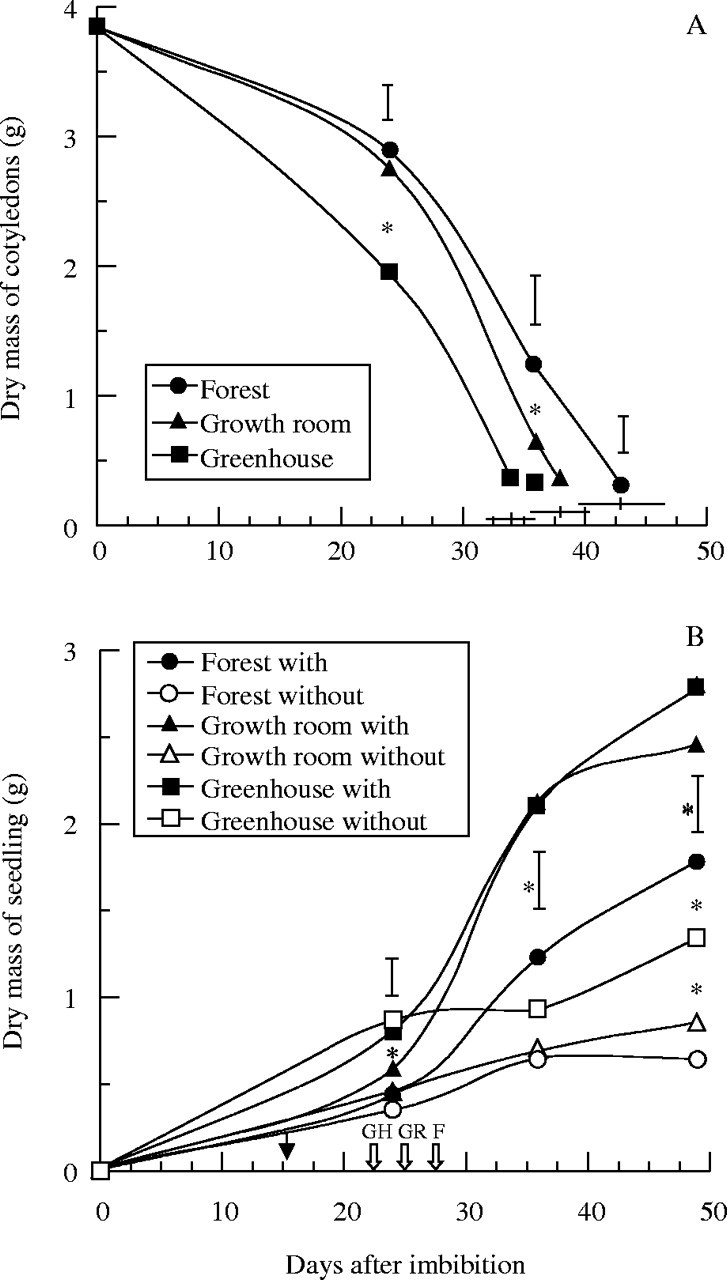
Fig. 2.

Changes in dry mass of (A) cotyledons and (B) total seedlings of H. courbaril. The seedlings were grown either in a greenhouse (GH), growth room (GR) or forest (F) with or without cotyledons; the that which these were detached is indicated by arrows. The black arrow indicates the date of germination (15 d after imbibition in all environments). The horizontal bars in (A) represent the mean of the date (± s.d.) by which cotyledons had dropped. Vertical bars represent results of a Tukey test (n = 5, P < 0·05). Asterisks indicate significant differences between treatments.
