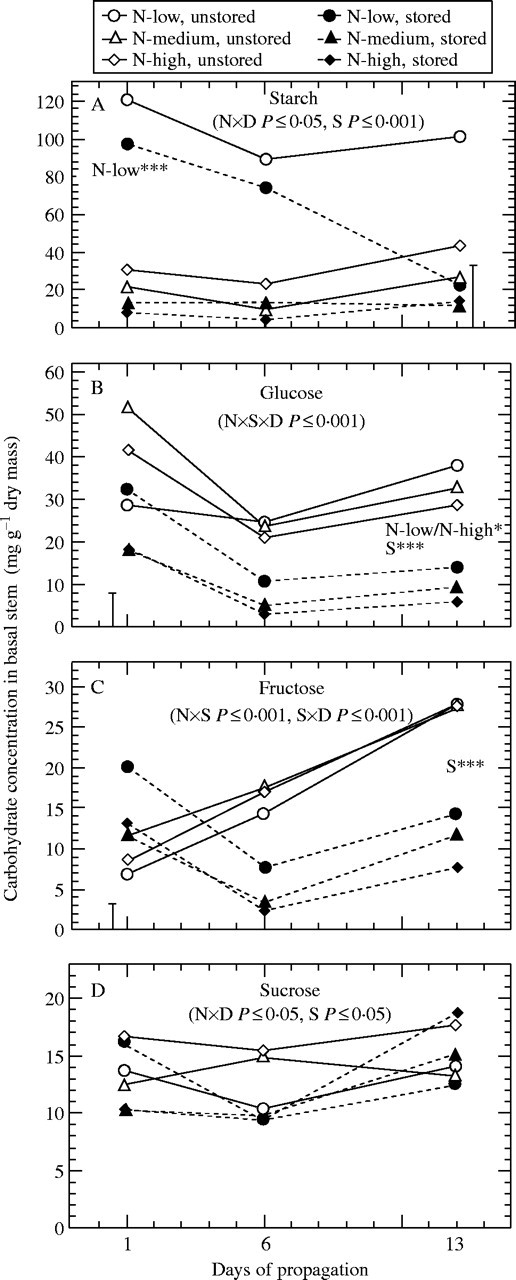
Fig. 3.

Effect of pre-harvest nitrogen supply and storage on concentrations of (A) starch, (B) glucose, (C) fructose, and (D) sucrose in the basal stem during propagation (n = 9). ×D indicates interaction with time. Where main effects are significant at days 1 and 13: N-low*** = N-low significantly different (P < 0·001) from other nitrogen treatments; N-low/N-high* = significant difference (P < 0·05) between low- and high-nitrogen; S*** = significant effect of storage at P < 0·001. In cases of significant interactions between nitrogen and storage, vertical bars represent LSD (P < 0·05).
