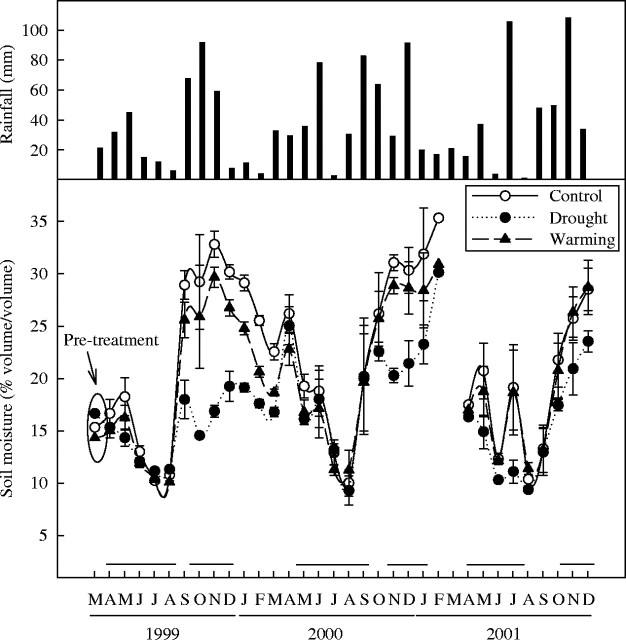
Fig. 1.
Monthly rainfall (mm) and mean soil moisture (% volume/volume) of control, drought and warming treatments throughout the study period. Error bars indicate the standard error of the mean (n = 2–5 d; values are averages of three plots). Lines above the months indicate the periods when drought treatment was acting. Data partly derived from Llorens et al. (2003b).

