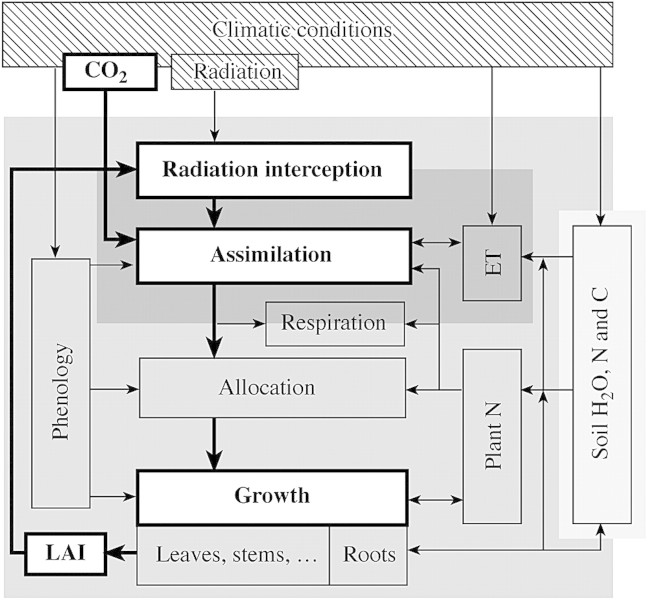
Fig. 1. Growth and developmental processes that are affected by elevated [CO2] and are commonly used in process‐based productivity models. Processes and relationships that are shown in white boxes and bold arrows are the ones primarily emphasized in the text. Grey areas indicate the temporal resolution of different processes ranging from seconds‐to‐hours (dark grey), to days (grey) and to decades‐to‐months (light grey).

An official website of the United States government
Here's how you know
Official websites use .gov
A
.gov website belongs to an official
government organization in the United States.
Secure .gov websites use HTTPS
A lock (
) or https:// means you've safely
connected to the .gov website. Share sensitive
information only on official, secure websites.
