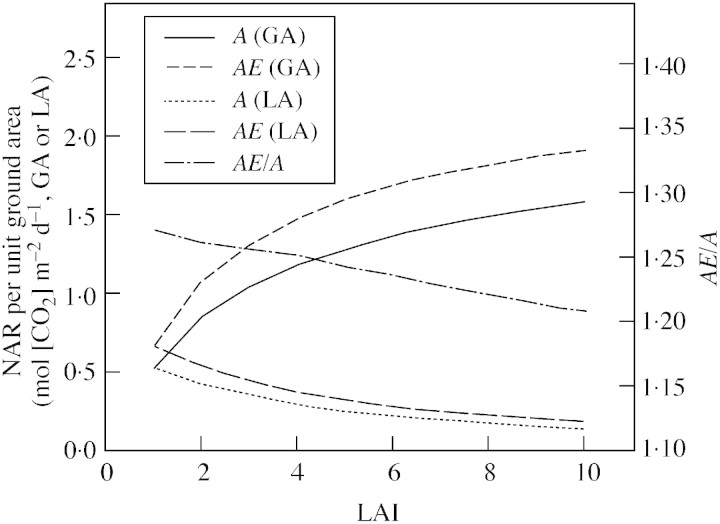
Fig. 4. Simulated (WIMOVAC) relationships between daily canopy net assimilation rate per unit ground area (GA) and per unit leaf area (LA) and LAI for ambient (A) and elevated (AE) [CO2]. Relative [CO2] effects are calculated from AE/A. Climate input data and [CO2] concentrations were the same as in Figs 2 and 3.

An official website of the United States government
Here's how you know
Official websites use .gov
A
.gov website belongs to an official
government organization in the United States.
Secure .gov websites use HTTPS
A lock (
) or https:// means you've safely
connected to the .gov website. Share sensitive
information only on official, secure websites.
