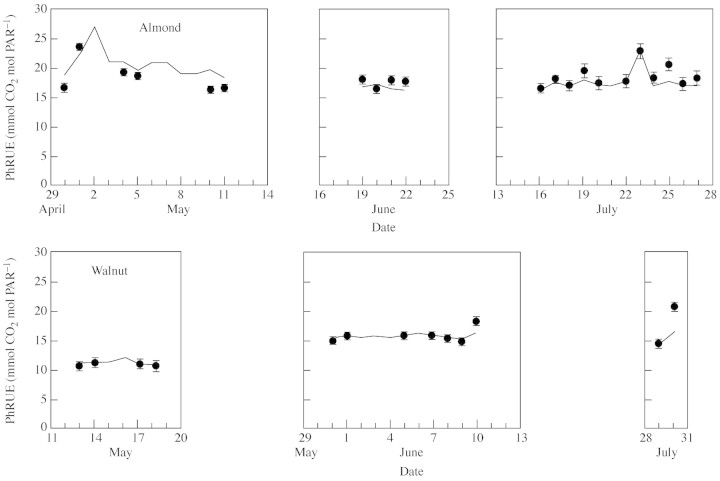
Fig. 2. Seasonal pattern of the slope (PhRUE) of the relationship between net CO2 assimilation and incident PAR, both integrated over a day, for individual leaves of almond and walnut. The slopes were calculated both with data on all sampled leaves (PhRUE50L, circles) and for a hypothetical leaf at the top of the canopy (PhRUEHL, solid line). Bars indicate the 95% confidence limits of the slopes (i.e. PhRUE50L).

An official website of the United States government
Here's how you know
Official websites use .gov
A
.gov website belongs to an official
government organization in the United States.
Secure .gov websites use HTTPS
A lock (
) or https:// means you've safely
connected to the .gov website. Share sensitive
information only on official, secure websites.
