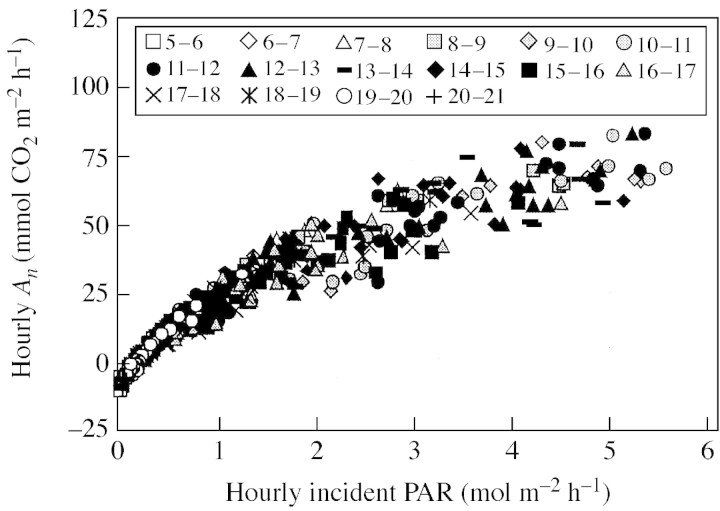
Fig. 3. Relationship between net CO2 assimilation integrated over 1 h (hourly An) and hourly incident PAR of individual leaves, for the same data shown in Fig. 1 (almond on 20 June 2003). Data for each hour (i.e. 0600–0700 . . . 1900–2000 h) are plotted using different symbols. The regression (not shown for clarity of graphs) had a significant quadratic component (P < 0·001).

An official website of the United States government
Here's how you know
Official websites use .gov
A
.gov website belongs to an official
government organization in the United States.
Secure .gov websites use HTTPS
A lock (
) or https:// means you've safely
connected to the .gov website. Share sensitive
information only on official, secure websites.
