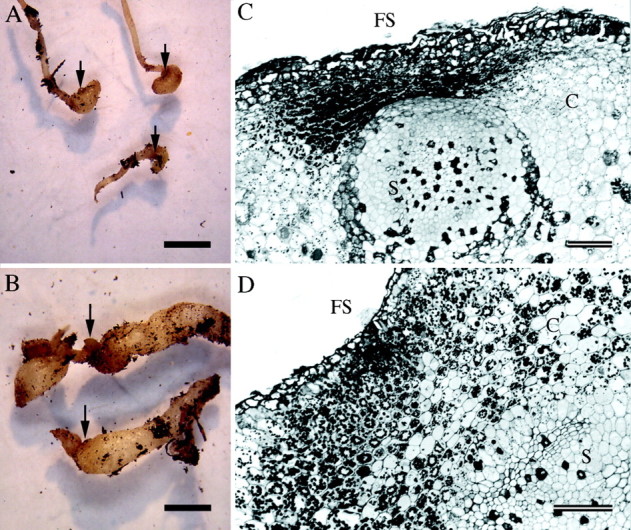
Fig. 1. Development and anatomy of nodosities induced by isolate VWL‐1. (A, B) Stage two and stage four nodosities, respectively. Scale bars = 2 mm. (C, D) Transverse sections though stage two and stage four nodosities, respectively, stained with PAS/TBO. Amyloplasts are evident in the cortex (C) between the feeding site (FS) and stele (S). Scale bars = 100 µm.
