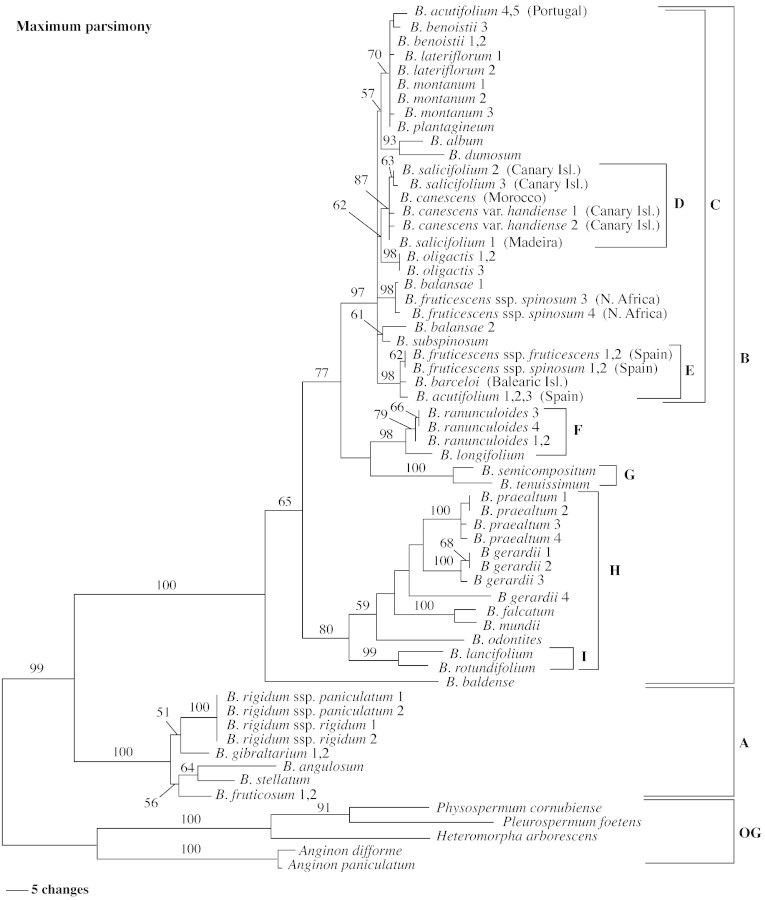
Fig. 2. One of 128 most‐parsimonious trees of 772 steps derived from equally weighted maximum parsimony analysis of sequences of the ITS region of Bupleurum and outgroup (OG) taxa (CI = 0·58; RI = 0·85). Branch lengths are proportional to the number of substitutions (see scale bar). Numbers represent bootstrap values; values <50 % are not indicated. The letters A–I represent the same Bupleurum groups referred to in Fig. 1.

An official website of the United States government
Here's how you know
Official websites use .gov
A
.gov website belongs to an official
government organization in the United States.
Secure .gov websites use HTTPS
A lock (
) or https:// means you've safely
connected to the .gov website. Share sensitive
information only on official, secure websites.
