
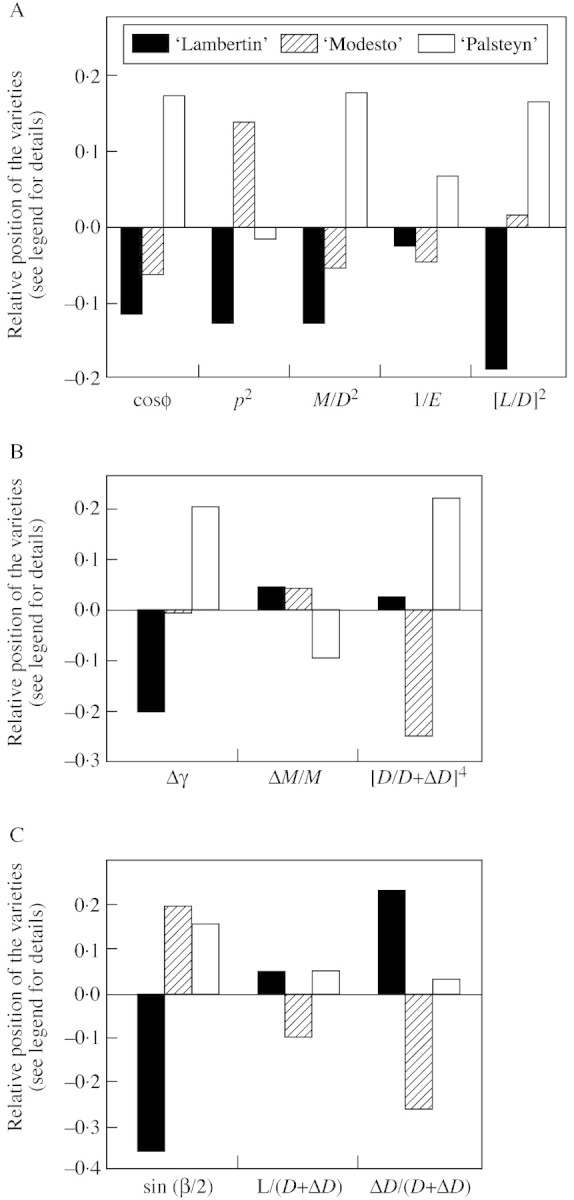
Fig. 9. Position of the varieties relative to each other for each re‐orientation factor. Each bar represents the difference between the mean log‐value for a given variety and the overall mean log‐value. (A) Period of passive bending (T0–T1); (B) period of passive uprighting (T2–T3); (C) period of active uprighting (T3–T4). A positive value means that the factor promotes reorientation for that variety more than for the other two varieties.