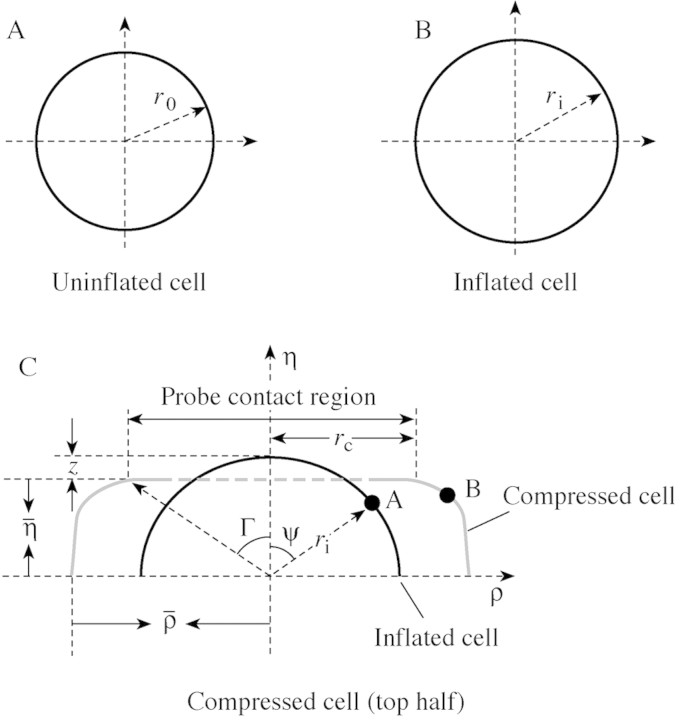
Fig. 3. Schematic diagram showing: (A) the geometry of the initial sphere; r0 is the initial radius of the cell before inflation; (B) the geometry of the inflated sphere before compression; ri is the radius of the cell after inflation; and (C) the geometry of a compressed sphere; η is the half‐distance between the probe surface and the plate, ρ is the maximum radius of the deformed wall and membrane. In compression, a typical point like A, at an angle ψ to the vertical axis of symmetry, moves to point B. The angle Γ identifies points that move to the edge of the contact region, which has radius rc.

An official website of the United States government
Here's how you know
Official websites use .gov
A
.gov website belongs to an official
government organization in the United States.
Secure .gov websites use HTTPS
A lock (
) or https:// means you've safely
connected to the .gov website. Share sensitive
information only on official, secure websites.
