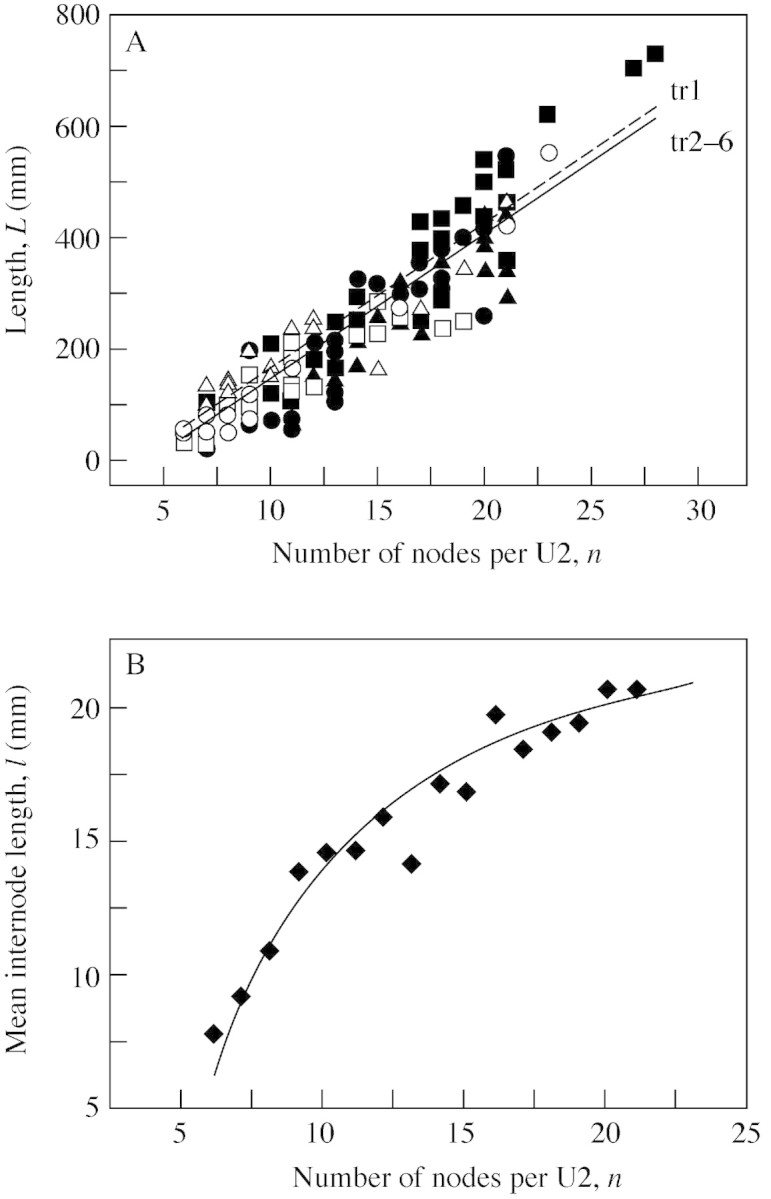
Fig. 5. Effect of treatment on total length L and internode length l of vegetative extension growth units U2 (Fig. 2B) from sympodial shoots. (A) Relationship between unit length, L and number on nodes n; symbols (key given in Table 1) represent data, and line graphs represent linear model L̂(n) fitted to the data (R2 = 0·88); treatment effect was significant (P = 0·004) for treatment 1. (B) Symbols represent l̄(n) mean internode length for sub‐populations of U2 with a given n, and line graphs represent model for average per unit internode length l̂(n).
