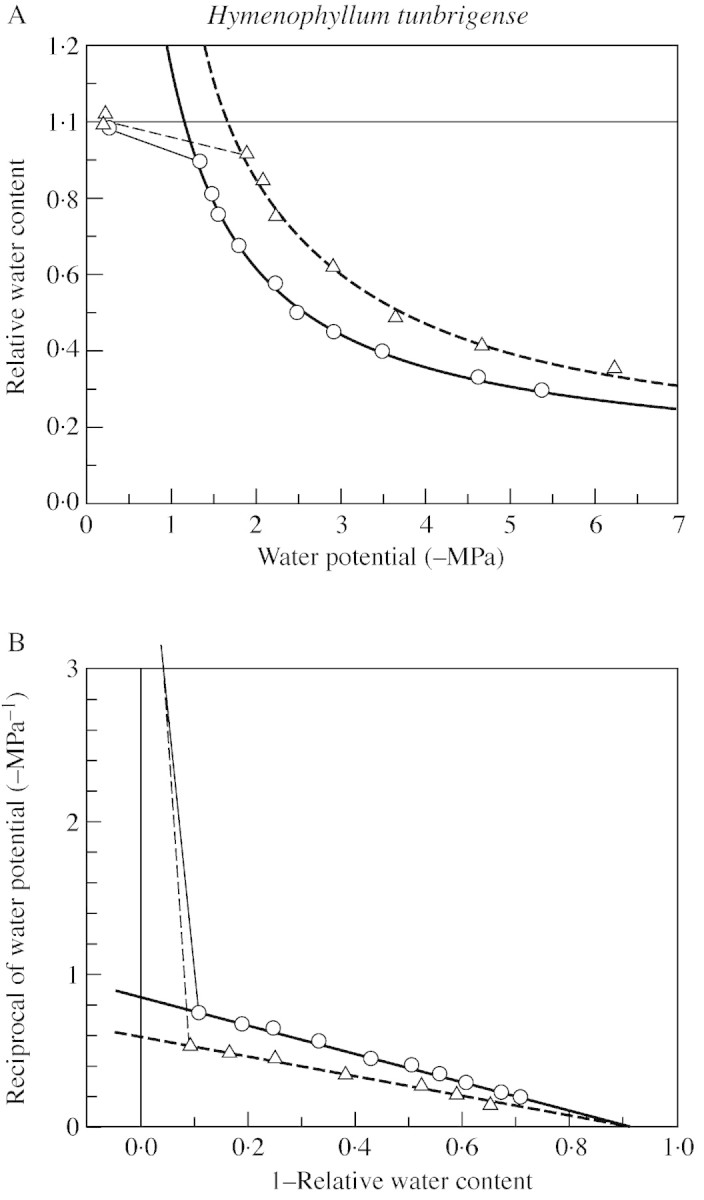
Fig. 5.Hymenophyllum tunbrigense. A, Relation of water potential to water content, from thermocouple‐psychrometric measurements, with hyperbolic regressions fitted to the observations below the turgor‐loss point. This presentation is equivalent to the Höfler diagram. B, Equivalent reciprocal‐transformed ‘P–V curves’, with linear regressions. For clarity, only two of the four measured data sets are shown. Material from White Wood, Holne, Dartmoor (16 Feb. 1999).
