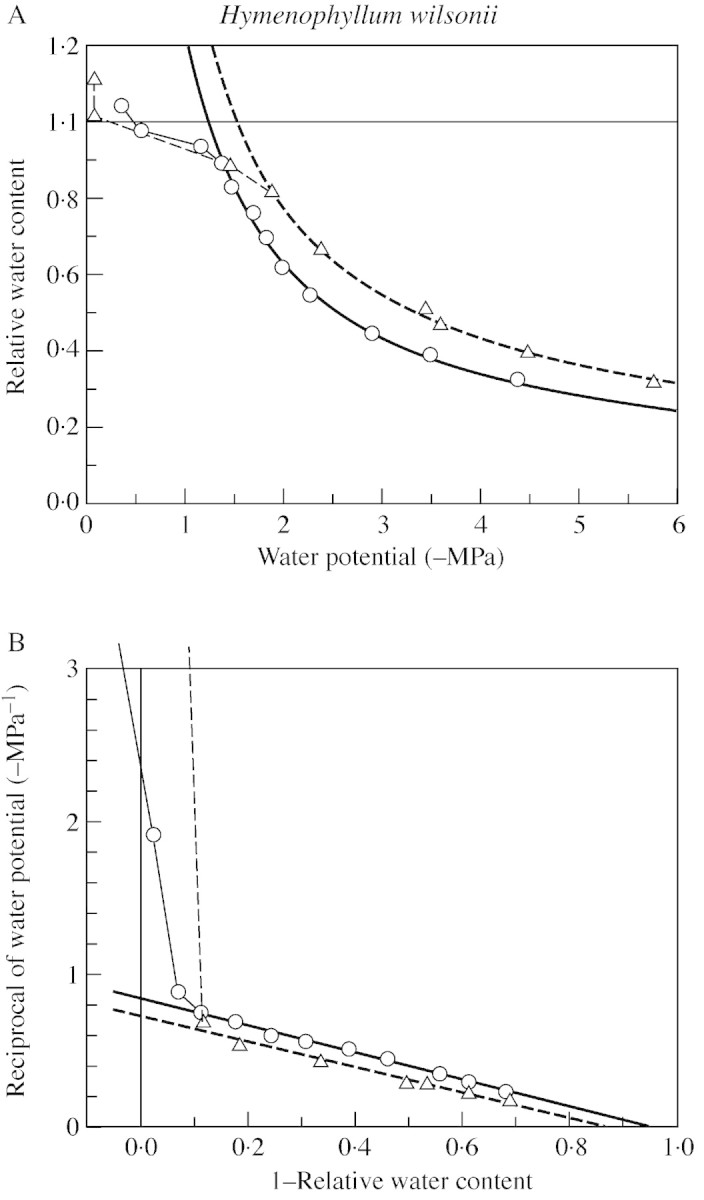
Fig. 6.Hymenophyllum wilsonii. A, Relation of water potential to water content, with hyperbolic regressions fitted to the observations below the turgor‐loss point. B, Equivalent ‘P–V curves’, with linear regressions. For clarity, only two of four data sets are shown. White Wood, Holne, Dartmoor (11 Feb. 1999). Compare Fig. 6.
