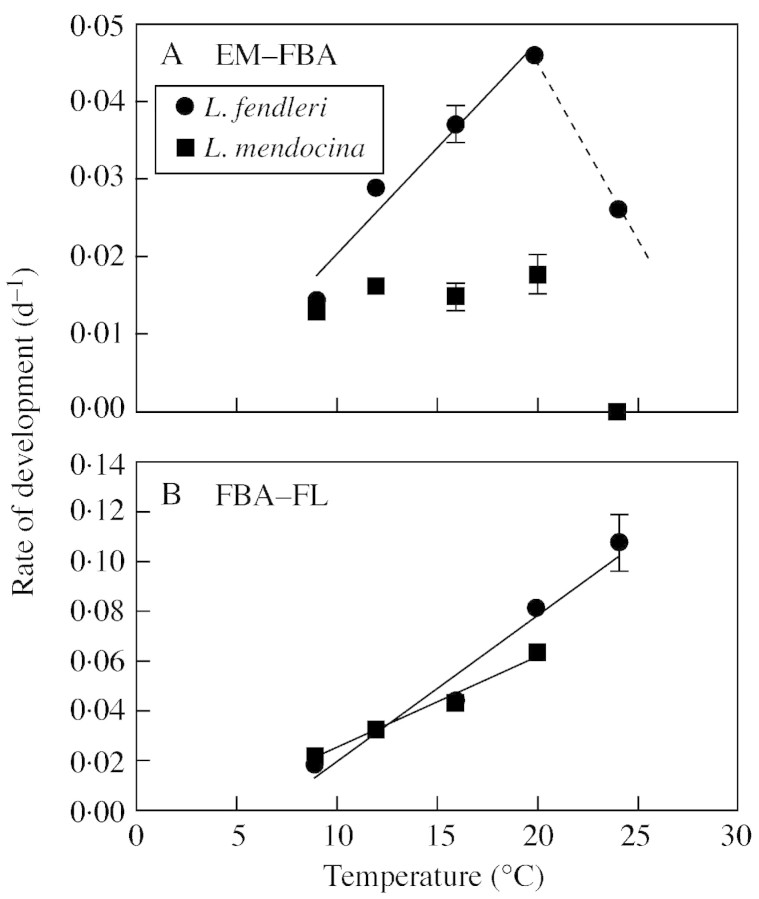
Fig. 2. Relationships between rate of development and temperature for L. fendleri and L. mendocina in two different phenophases: (A) emergence to floral bud appearance, and (B) floral bud appearanc to first flower open. The solid lines were fitted by linear regression and broken lines were drawn by hand. Each point is the mean of ten plants for L. fendleri and of 6–10 plants for L. mendocina. Error bars indicate s.e. and are shown only when larger than the symbols.

An official website of the United States government
Here's how you know
Official websites use .gov
A
.gov website belongs to an official
government organization in the United States.
Secure .gov websites use HTTPS
A lock (
) or https:// means you've safely
connected to the .gov website. Share sensitive
information only on official, secure websites.
