
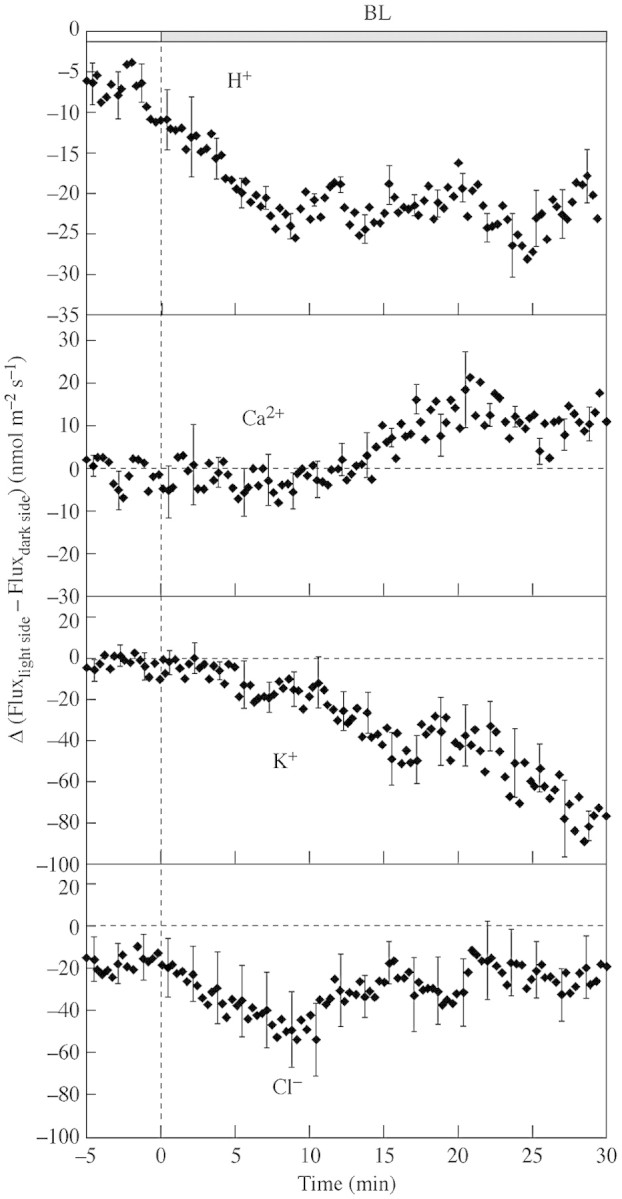
Fig. 4. The effect of BL on Δ, calculated as the difference between fluxes from the light side and the dark side, calculated from net H+, Ca2+, K+ and Cl– fluxes before BL onset and during BL illumination. The positive values indicate relatively higher influx into the light side than into the dark side. Representative error bars are ± s.e. (n = 6–10).