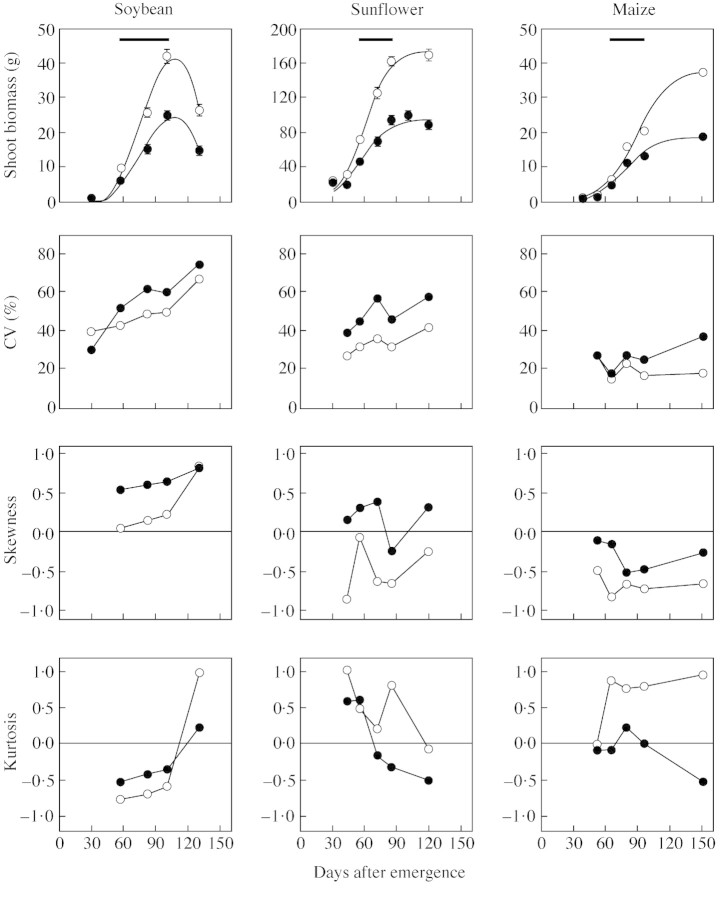
Fig. 1. Evolution of the mean and its standard error, the coefficient of variation (CV), skewness and kurtosis of biomass per plant in soybean, sunflower and maize grown at two plant population densities: standard (D = 30, 6 and 8·5 plants m–2, respectively; open symbols) and high (2D; closed symbols). Horizontal bars in the upper panel indicate the critical period for seed set. In soybean, typical leaf shedding accounted for the decrease in biomass at maturity.

An official website of the United States government
Here's how you know
Official websites use .gov
A
.gov website belongs to an official
government organization in the United States.
Secure .gov websites use HTTPS
A lock (
) or https:// means you've safely
connected to the .gov website. Share sensitive
information only on official, secure websites.
