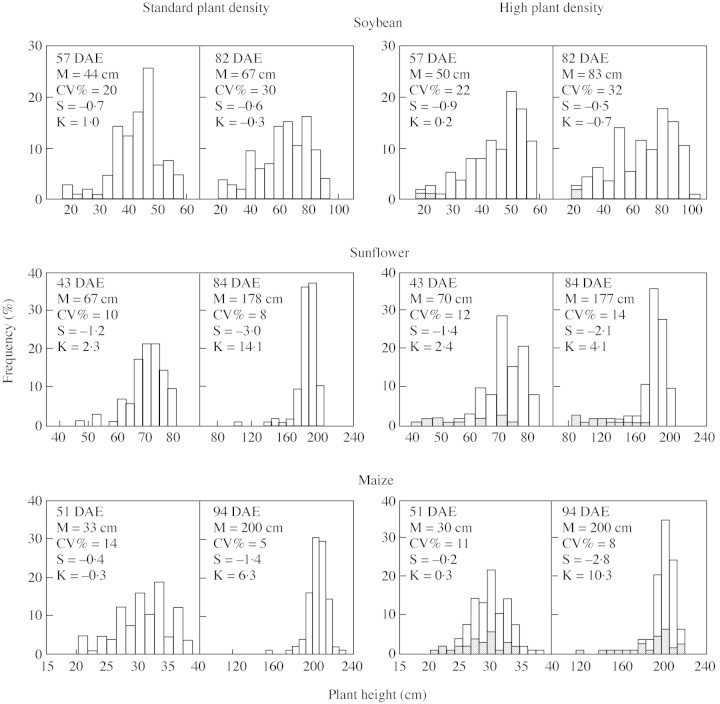
Fig. 2. Frequency distributions of plant height measured during vegetative and reproductive stages in soybean, sunflower and maize plants grown at standard and at high plant population densities. DAE, Days after crop emergence; M, mode; CV, coefficient of variation; S, skewness; K, kurtosis. Grey bars indicate position of ultimately barren individuals.

An official website of the United States government
Here's how you know
Official websites use .gov
A
.gov website belongs to an official
government organization in the United States.
Secure .gov websites use HTTPS
A lock (
) or https:// means you've safely
connected to the .gov website. Share sensitive
information only on official, secure websites.
