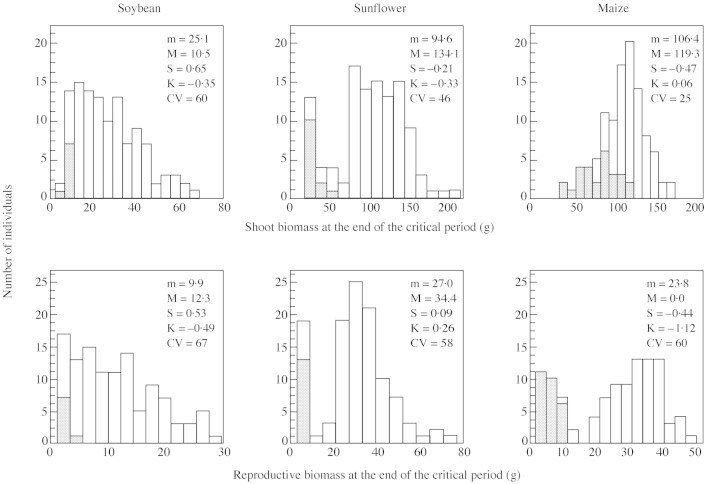
Fig. 3. Frequency distributions of plant shoot and reproductive biomass at the end of the critical period for seed set in crowded populations of soybean (n = 114), sunflower (n = 111) and maize (n = 105). m, Mean; M, mode; CV, coefficient of variation; S, skewness; K, kurtosis. Grey bars indicate position of ultimately barren plants.

An official website of the United States government
Here's how you know
Official websites use .gov
A
.gov website belongs to an official
government organization in the United States.
Secure .gov websites use HTTPS
A lock (
) or https:// means you've safely
connected to the .gov website. Share sensitive
information only on official, secure websites.
