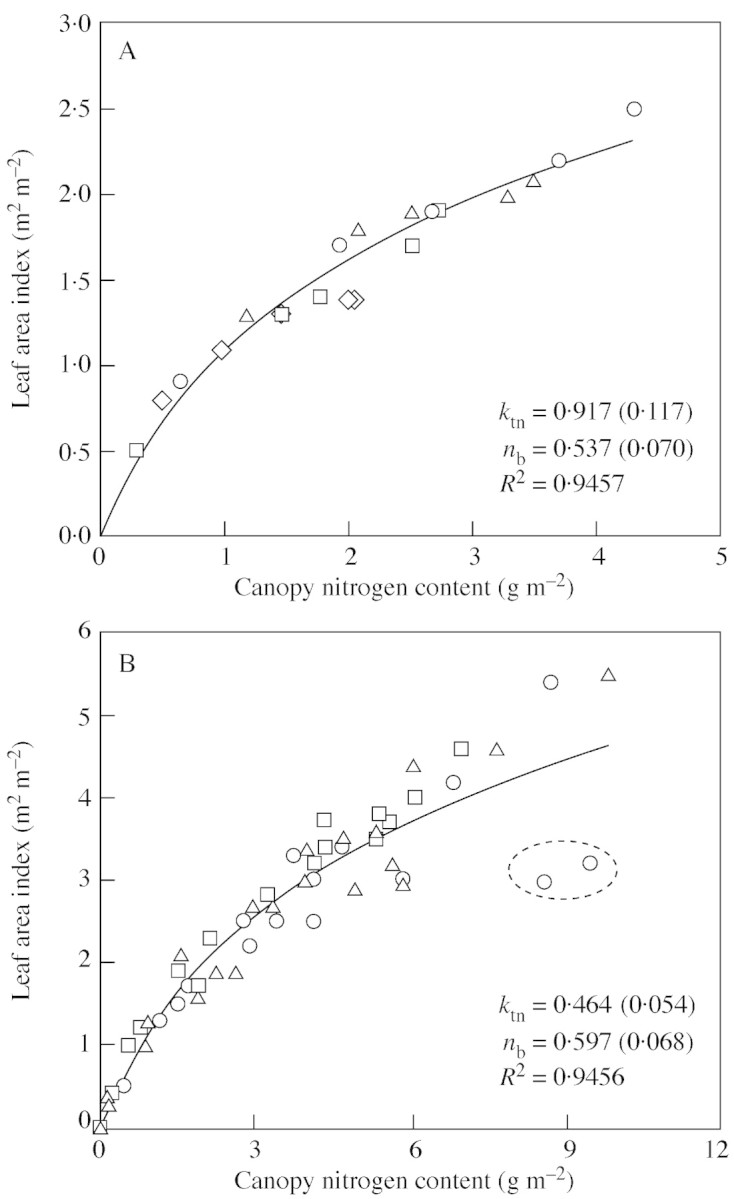
Fig. 1. Relationship between leaf area index and canopy nitrogen content for fully developed canopies, based on data of Connor et al. (1995) for sunflower ‘Prosol 35’ (A), and of Groot and Verberne (1991) for winter wheat ‘Arminda’ (B). Different symbols represent four different treatments (A) or three experimental locations (B). The two encircled points in B are outliers, resulting from a late application of nitrogen fertilizer. The curves represent eqn (2), with parameters (standard error in parentheses) fitted to all data points.
