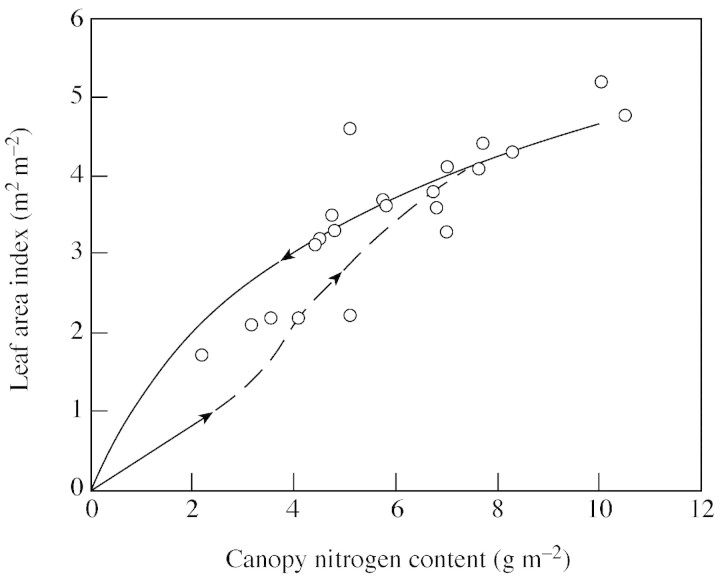
Fig. 9. Relationship between leaf area index (L) and canopy nitrogen content (N) for the early phase (the full line re‐plotted from Fig. 8A) and for the late senescence phase (the logarithmic curve re‐plotted from Fig. 1B), and the expected L–N relationship for the mid‐development phase (dashed curve). Points are from the mid‐phase samplings in the fertilizer experiments of Groot and Verberne (1991). Arrows indicate the temporal direction of L or N in the three phases.

An official website of the United States government
Here's how you know
Official websites use .gov
A
.gov website belongs to an official
government organization in the United States.
Secure .gov websites use HTTPS
A lock (
) or https:// means you've safely
connected to the .gov website. Share sensitive
information only on official, secure websites.
