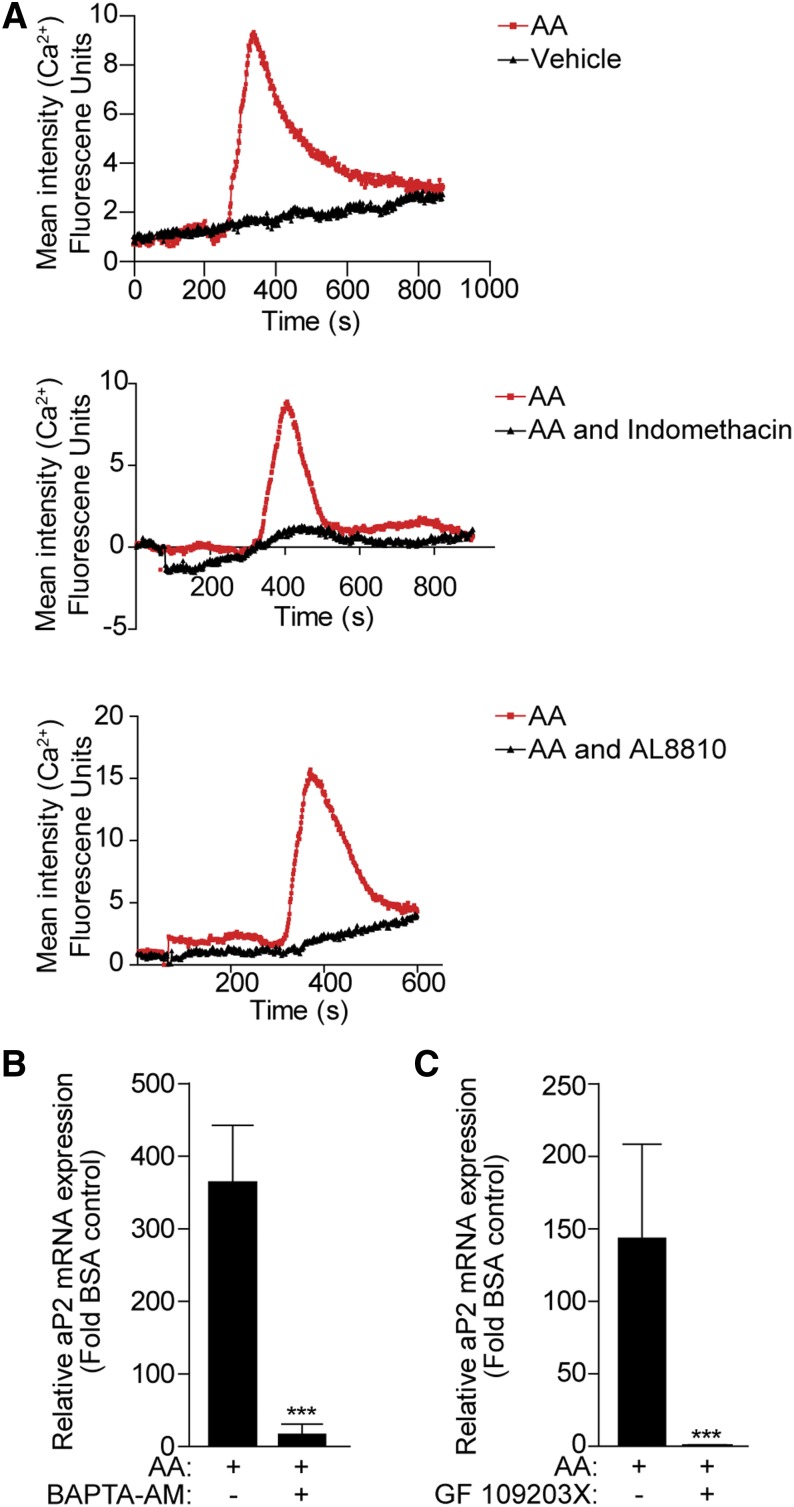
Fig. 3.
The calcium and PKC signaling pathway mediates the effect of AA on aP2 expression. A: 3T3-L1 cells (day 0) were loaded with calcium-sensitive Fluo-4 before stimulation with 10 μM AA (red line) or BSA-vehicle (black line), and calcium mobilization was determined by live cell imaging for 10–15 min (top panel). Cells were pretreated with indomethacin (10 μM) (middle panel) or AL 8810 (10 μM) (lower panel) for 30 min before stimulation with AA (10 μM). A representative experiment from three independent experiments is shown. B, C: 3T3-L1 cells (day 0) were pretreated with BAPTA-AM (30 μM) or GF109203X (10 μM), as indicated, for 30 min prior to 100 μM AA treatment for 24 h. Total RNA was extracted and subjected to RT-PCR for aP2 mRNA transcript. Data are presented as mean ± SEM of n = 3. ***P < 0.001.

