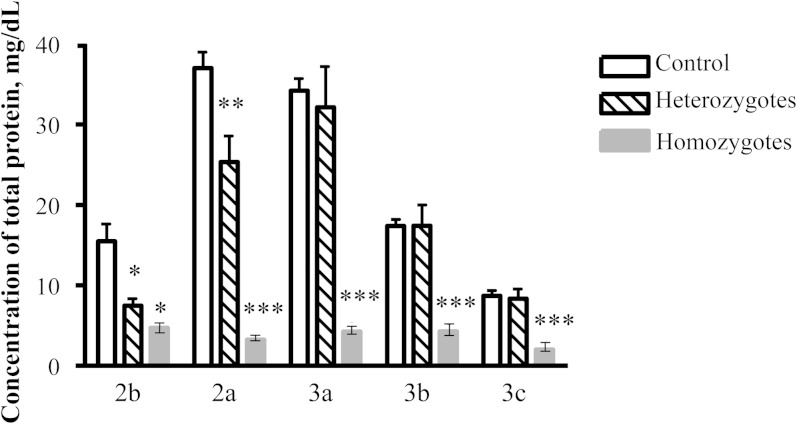
Fig. 2.
Total protein concentration in HDL subpopulations, expressed as mg/dl, in homozygous (n = 2) and heterozygous (n = 6) apoA-I-deficient subjects. Note that no apoA-I was detected in HDL from the homozygous subjects; ** P < 0.01, * P < 0.05 versus controls (n = 11). Data obtained in two homozygotes are shown as means, and the range of individual values is represented as min–max.

