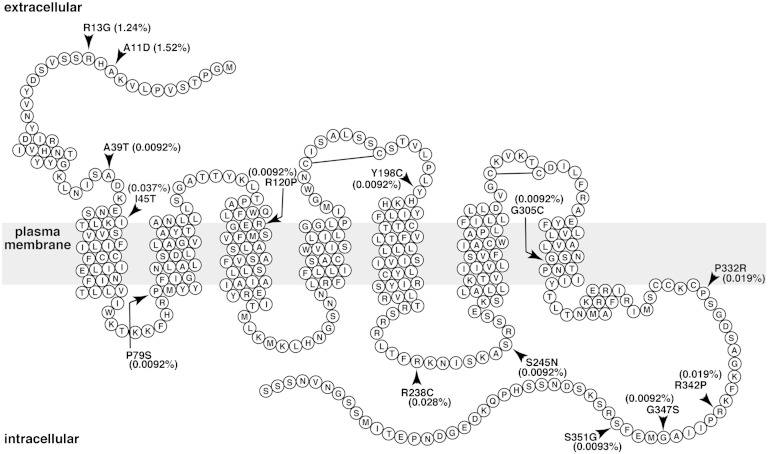
Fig. 1.
Serpentine diagram of the secondary structure of human S1P1. Each circle represents one amino acid residue with a one letter amino acid code. The gray rectangle represents the plasma membrane. Positions of α-helixes were determined by referring the crystal structure of S1P1 (Protein Data Bank number 3V2Y) and by using a hydrophobicity-calculation program, SOSUI. Arrowheads denote the positions of amino acids changed in the 14 nonsynonymous mutations in the NHLBI GO ESP database. Prevalence of the 14 mutations is shown as percent of total sample numbers. Two extracellular disulfide bonds are also shown.

