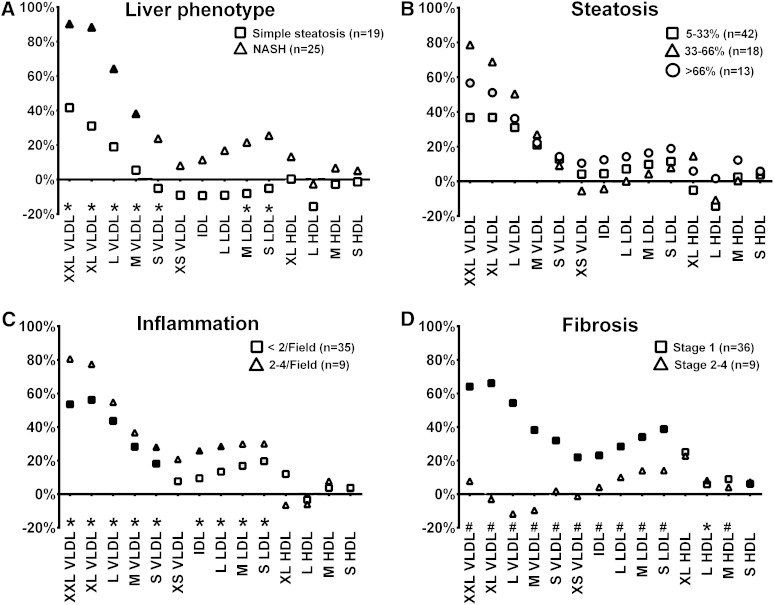
Fig. 1.
Lipoprotein subclass lipid concentration in individuals divided into groups by liver phenotype divided to those with normal liver histology (n = 32), simple steatosis without inflammation and cell injury (n = 19) and to those with NASH (n = 25) (A), steatosis grade (B), lobular inflammation (C), and fibrosis stage (D). Percentage changes comparing to the group without the pathology (set to 0%) have been calculated. Statistical significance over all groups (normal and all degrees of pathology in each panel) are visualized with FDR < 0.05 (*) and FDR < 0.01 (#) compared with individuals without the pathology below the horizontal axis in each panel. The color of the symbol indicates subgroup analysis comparing a given group to the group without pathology (gray indicates P < 0.05, black indicates P < 0.01).

