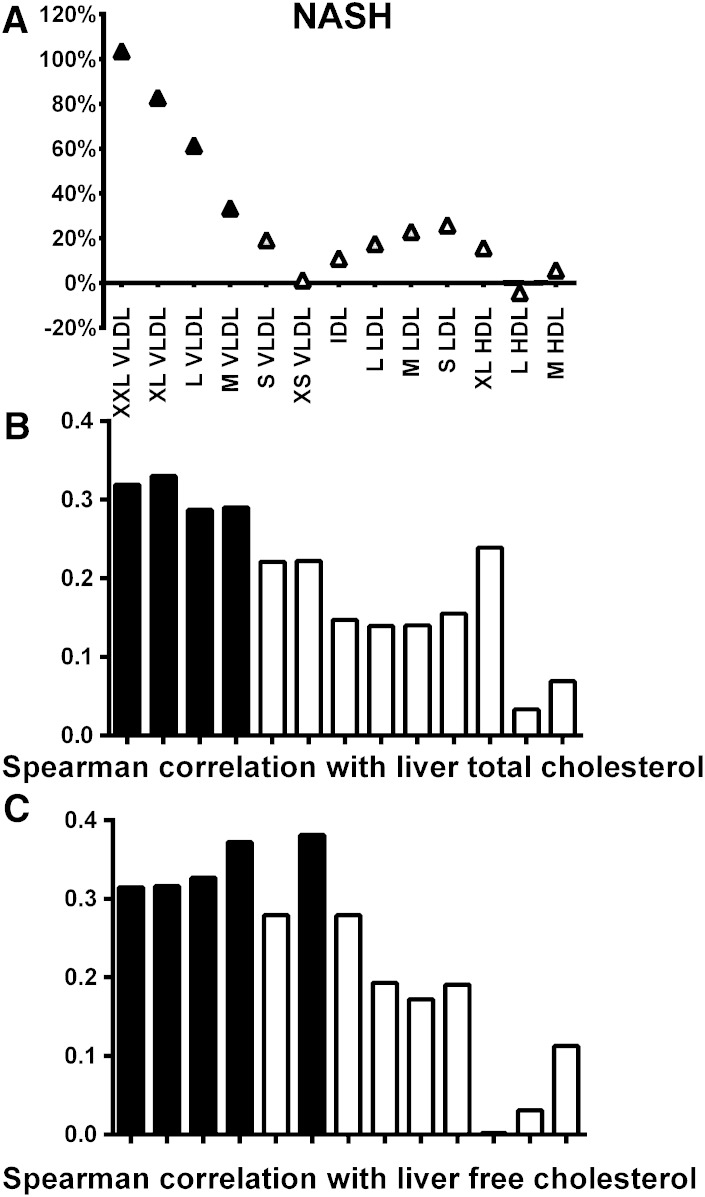
Fig. 2.
A: Lipoprotein subclass cholesterol concentration in individuals with NASH compared with those with normal liver histology. Percentage changes comparing to the group without the pathology (set to 0%) have been calculated and statistical significance is shown as in Fig. 1. Spearman correlation between lipoprotein subclass cholesterol concentration and liver cholesterol content (B) and liver free cholesterol content (C) (black bars, P < 0.05).

