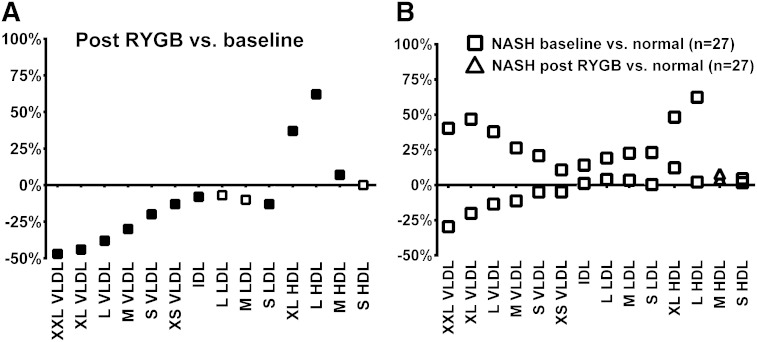
Fig. 3.
Changes in lipoprotein subclass lipid concentrations (A) in response to RYGB in the whole study group compared with baseline. B: Shows the effect of RYBG specifically in individuals with NASH by showing the difference between the NASH group and the normal group at baseline (squares) and the NASH group after RYGB compared with the normal group at baseline (triangles). The color of the symbol indicates subgroup analysis comparing a given group to the group without pathology (A) or to baseline (B) (gray indicates P < 0.05, black indicates P < 0.01).

