
Figure 2.
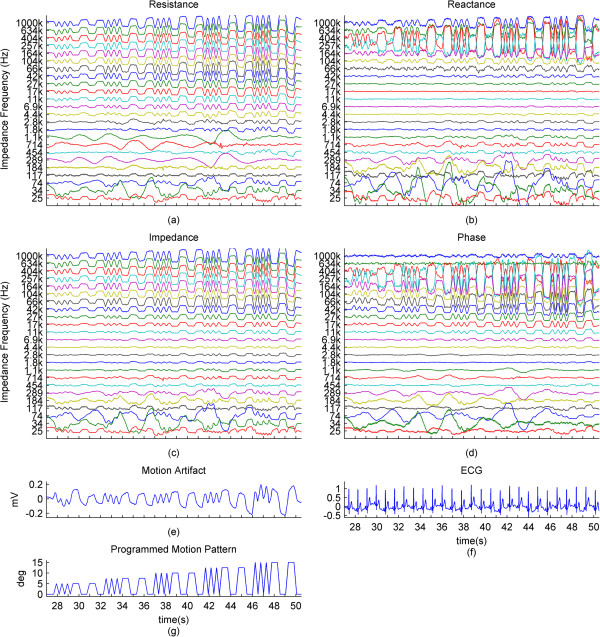
Impedance and surface biopotential changes caused by applied motion. (a), (b): The change of resistance and reactance in percentages relative to the baselines for each impedance current frequency. (c), (d): Impedance in percentages to the baseline, and the phase in degrees, for each impedance current frequency. For these four graphs, the vertical spacing between consecutive waveforms is set to correspond to a 1% change for the impedance and 1 degree for the phase. (e), (f): Motion artifact and ECG affected by the motion artifact. (g): The motion pattern. The time window of all graphs corresponds to one run of the motion pattern, specifically the middle portion of the pattern presented in Figure 1c, around 24 seconds long. The x-axes for all graphs are same.