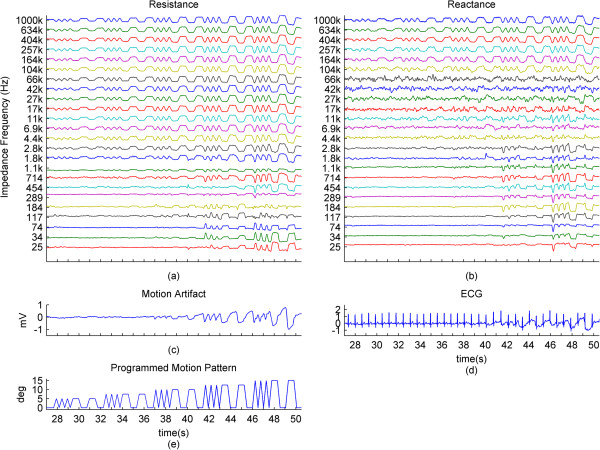
Figure 3.

Normalized impedance changes and biopotential changes caused by applied motion. (a), (b): The resistance and reactance normalized between 0 and 1 for each impedance current frequency. (c), (d): The motion artifact and the ECG. (e): Corresponding motion pattern. For demonstration puposes, the presented data is from a subject different than for Figure 2. This data set shows little baseline wander and good relation to motion at the lower group of impedance current frequencies. The x-axes for all graphs are same.
