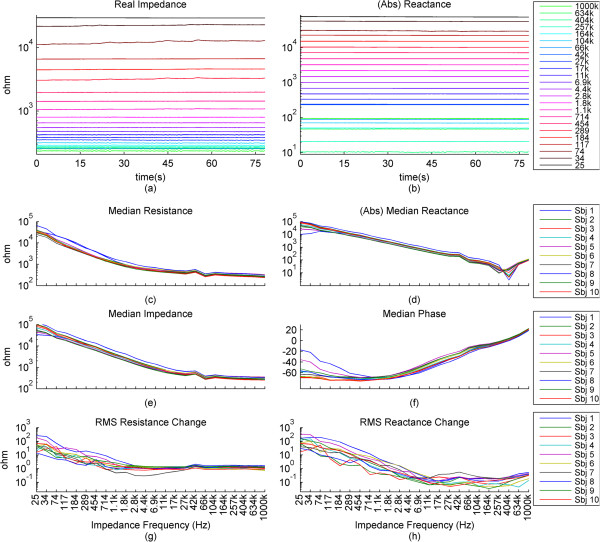
Figure 4.

Presenting the raw impedance signal for one subject and the median and RMS values of various impedance signals of all subjects plotted against frequency. (a), (b): The raw resistance data and the absolute of the raw reactance data for one subject plotted against time for each impedance current frequency. (c), (d): The medians of the resistance data and the absolute values of the reactance data for all subjects combined, plotted against impedance current frequencies. (e), (f): The median of the calculated impedance and of the phase of the impedance for all subjects, plotted against impedance current frequencies. (g), (h): The RMS values of the changes in resistance and reactance induced by motion, for all subjects, plotted against impedance current frequencies. The x-axes for the graphs (c), (d) (e), (f), (g), (h) are the same. All graphs except the phase are in the log scale. Thus, for the impedance values in the negative, the absolute values are presented.
