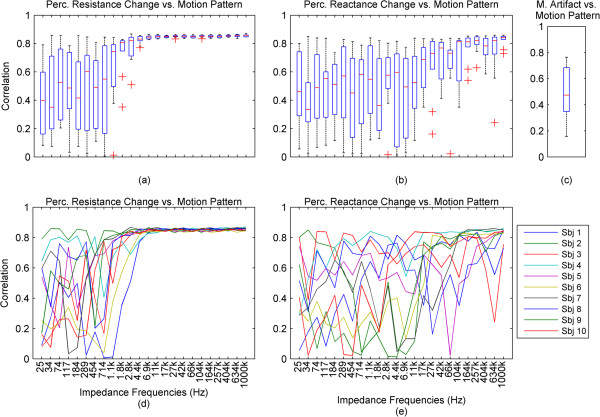
Figure 5.

Time doamin correlations of resistance and reactance to the applied motion pattern. (a), (b): The boxplots of time domain correlations between resistance and the motion pattern, and between reactance and motion pattern for all subjects, plotted against impedance current frequencies. (c): The boxplot of the correlation between the motion artifact and the motion pattern for all subjects. (d), (e): The correlation data corresponding to graphs (a) and (b), plotted against impedance current frequencies seperately for each subject. The x-axes for all graphs are same.
