Figure 4.

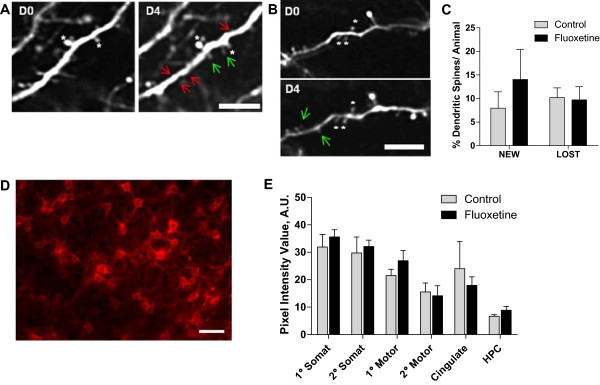
The effects of fluoxetine treatment on dendritic spine turnover and PNNs. A-C: Dendritic spine turnover was measured in adult mouse visual cortex in vivo, by imaging cortical dendrites four days apart using 2-photon microscopy. A) Representative images of dendritic spine turnover in control mice display both gain and loss of spines between imaging sessions (green arrows - new spines, red arrows - lost spines). B) Fluoxetine treated mice demonstrated similar numbers of new spines and lost spines. White asterisks denote reference spines between images. C) Quantification of dendritic spine turnover showed no significant difference between the percentage of new and lost spines in fluoxetine and control groups. Data are mean ± SEM, n = 4-5 per group. D-E: WFA antibody was used to visualize PNNs. D) PNNs are revealed around neuronal cell bodies in mouse cerebral cortex. E) Quantitative analysis of WFA staining in the control and fluoxetine groups was performed in primary (1°) and secondary (2°) somatosensory cortex (somat), 1° and 2° motor cortex (motor), cingulate cortex (cingulate), and the hippocampus (HPC). No significant changes were observed. n = 5-6 per group. Scale bar: A-B, 5 μm, D, 50 μm.
