
Figure 5.
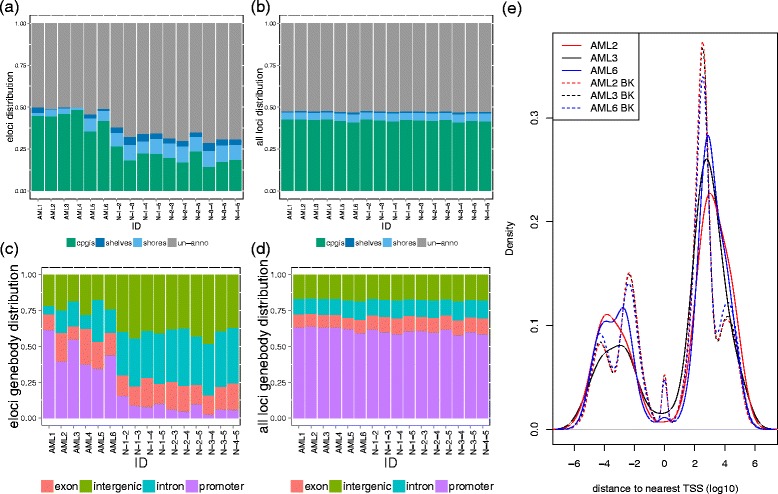
Genome distribution of the eloci during leukemia progression. (a, b) The distribution of eloci (a) and background loci (b) in CpG islands, shores, shelves, and the rest of the genome. (c, d) The distribution of eloci (c) and background loci (d) in promoter, exon, intron of RefSeq gene model and intergenic regions. (a- d) eloci from pairwise comparison of five NBM were also plotted to compare and contrast with the eloci during leukemia progression. (e) The density plot of the distances of the eloci (solid lines) and background loci (BK: dashed lines) to the nearest transcription starting sites (TSS) in log10 scale for AML2 (red), AML3 (black), and AML6 (blue).