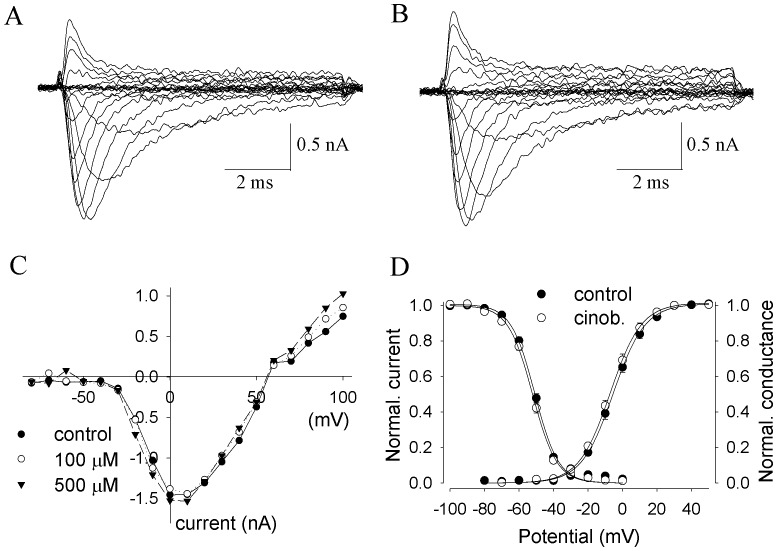
Figure 7. Cinobufagin had no effects on Nav1.2 channels.
A, B Recording traces of activation of Nav1.2 currents in control (A) and in 100 µM cinobufagin (B). The currents were elicited by stepping to various depolarized potentials (ranging from −80 to +100 mV in 10-mV increments) for 9 msec, and then returning to the holding potential of −100 mV. C The current-voltage (I–V) relationships in control and in the presence of various concentrations of cinobufagin. Peak currents at each depolarized potential were measured. The data are from a representative cell. D Cinobufagin did not change Nav1.2 channel activation and inactivation. Activation: From the peak Na+ currents as obtained in A and B, the Na+ conductance values (G) were calculated (n = 3–5 for each point), normalized to the maximum in control and plotted as a function of membrane potentials (V). Inactivation: The voltage dependence of steady-state inactivation (h ∞) was examined by applying 500-msec prepulse potentials from −100 mV to 0 mV in 10-mV increment from a holding potential of −100 mV before stepping to the test potential (0 mV) for 35 msec (n = 5 for each point). The peak current (I) for each cell was normalized with respect to the first value measured at test potential (0 mV). Conductance–voltage relationships or inactivation–voltage relationships from individual cells were fitted with a Boltzmann function, y = 1/{1 + exp[(V – V .5)/k]} or y = 1- 1/{1 + exp[(V – V .5)/k]}, where V is membrane potential, V .5 is the half-activation (V a) or half inactivation (V h) voltage, and k is a slope factor.

