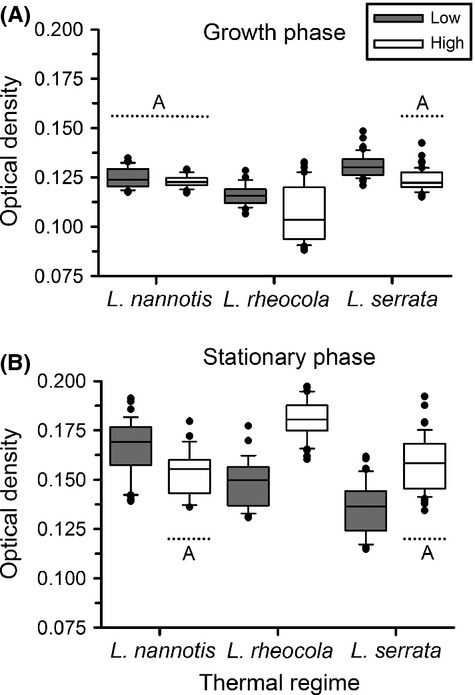
Figure 2.

Box plots showing distributions of the optical density of Batrachochytrium dendrobatidis during the (A) logarithmic growth phase (Day 7 of our experiment) and (B) the stationary phase (Day 13), shown for the frogs Litoria nannotis, L. rheocola, and L. serrata at both low and high elevations. Horizontal lines indicate sets of temperatures that did not differ significantly; letters indicate groupings. Any temperature regime not included in a group differed significantly from all other temperature regimes for that isolate.
