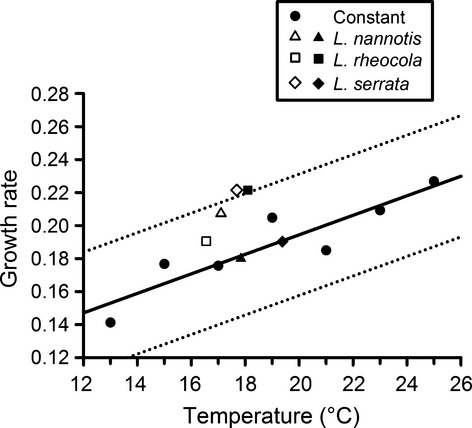
Figure 4.

Growth rate (maximum change in optical density) of Batrachochytrium dendrobatidis under constant-temperature incubation (13, 15, 17, 19, 21, 23, and 25°C) (Stevenson et al. 2013) and under the fluctuating thermal regimes representing three frog species from low (closed symbols) and high (open symbols) elevations: Litoria nannotis, L. rheocola, and L. serrata. The maximum fluctuating regimes for each frog species and elevation were averaged throughout the day to obtain a mean overall value. The trend lines represent the predicted mean and 95% prediction intervals from a regression of the constant temperature growth data. The two fluctuating thermal regimes that are outside of the 95% prediction limits for constant temperature data are L. serrata from high elevations and L. rheocola from low elevations. Fluctuating thermal regimes are shown in Fig. 1.
