
Figure 2.
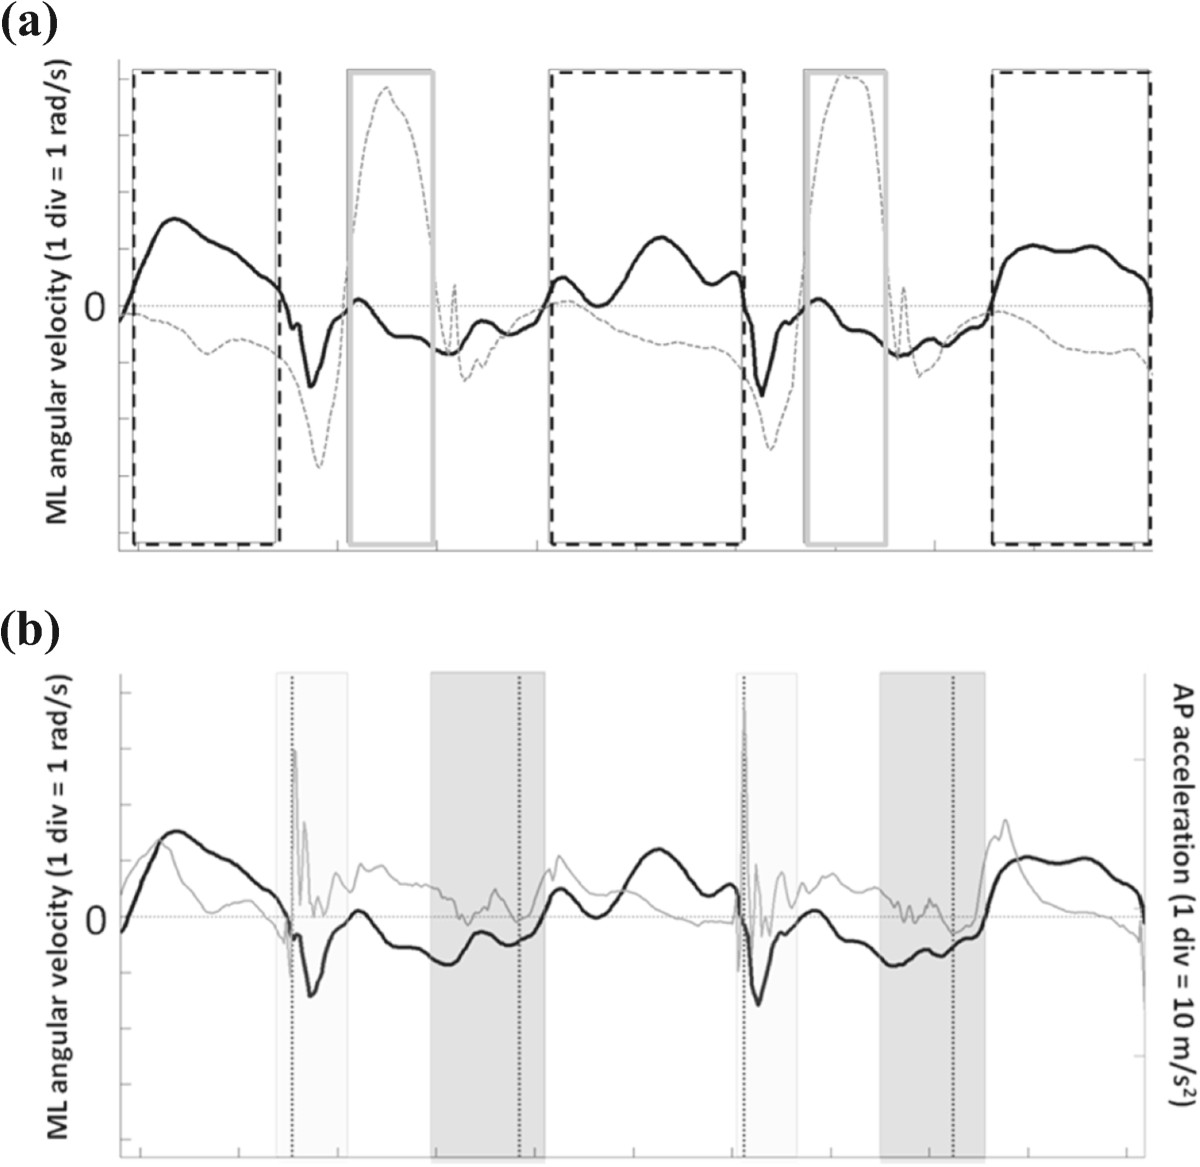
Gait events detection from MIMU signals. (a) Angular velocities in the sagittal plane (ωz) for a hemiparetic subject are reported (black line: affected side). Rectangular frames represent trusted swing (dotted line) and trusted stance (solid line) intervals for the affected limb. (b) ML angular velocity (black line) and AP acceleration (gray line) for the affected side of a hemiparetic subject. Colored boxes represent time intervals for the IC (light gray) and FC (intense gray) search; dotted vertical lines represent the GEs timings.